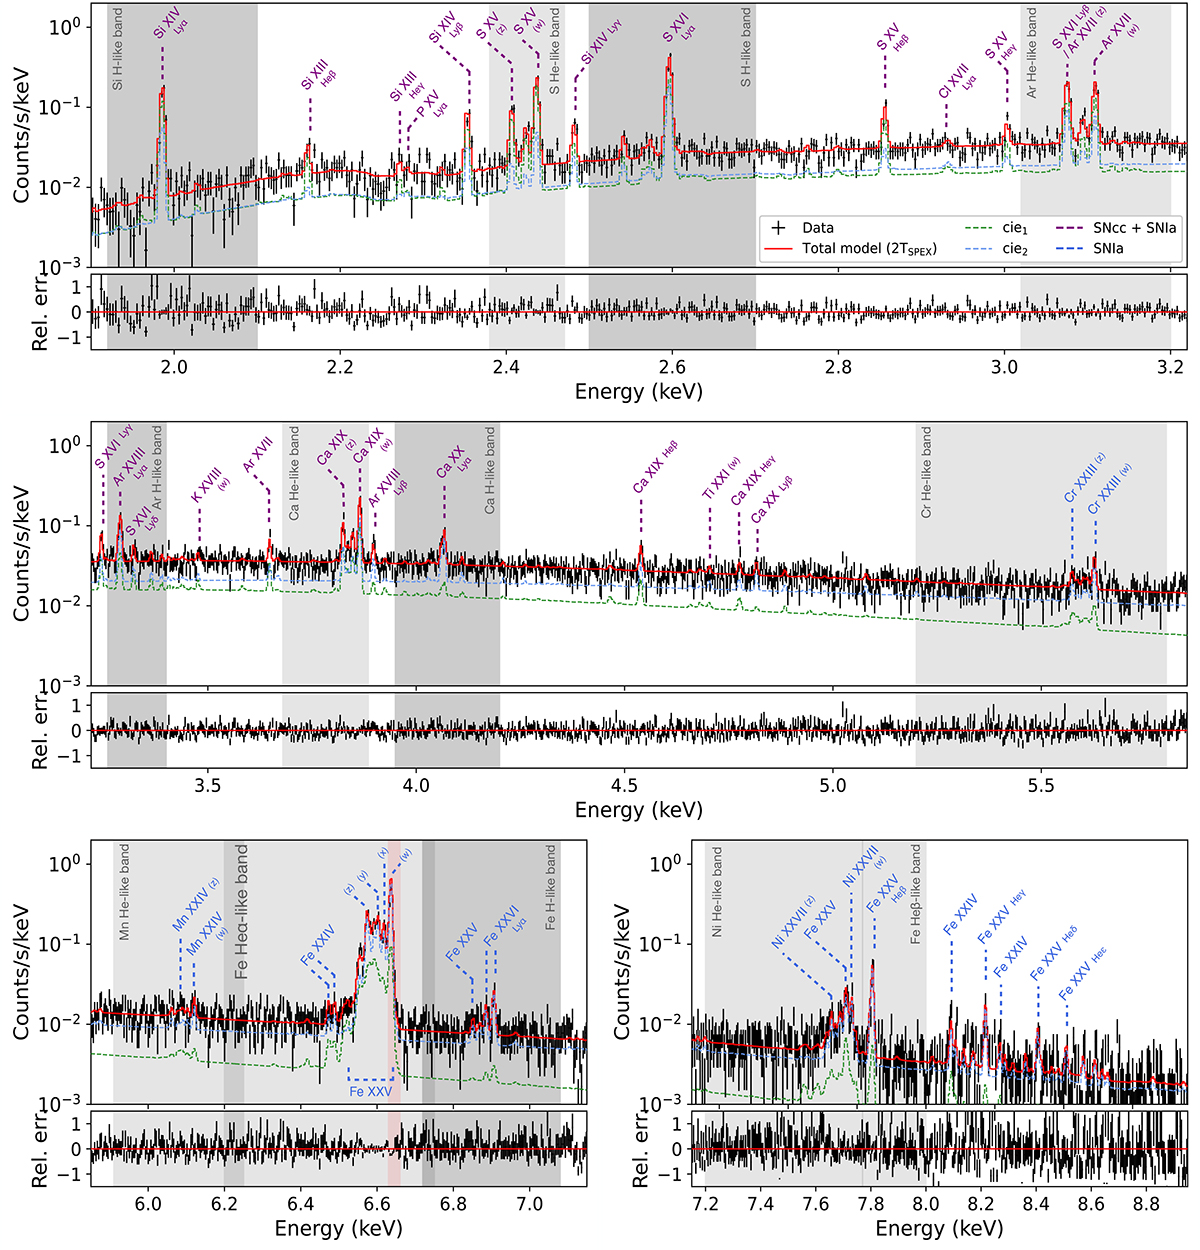
Fig. D.1.
Download original image
Zoomed-in Resolve spectrum as shown in Fig. 2 right. Restricted energy bands used for our narrow-band fitting approach are indicated (dark and light grey for H-like and He-like elements, respectively). The red area shows the energy band that is excluded in all our fits to avoid biases induced by resonant scattering effects. The scaling of the y-axis (counts/s/keV) is kept constant between all panels for consistency.
Current usage metrics show cumulative count of Article Views (full-text article views including HTML views, PDF and ePub downloads, according to the available data) and Abstracts Views on Vision4Press platform.
Data correspond to usage on the plateform after 2015. The current usage metrics is available 48-96 hours after online publication and is updated daily on week days.
Initial download of the metrics may take a while.