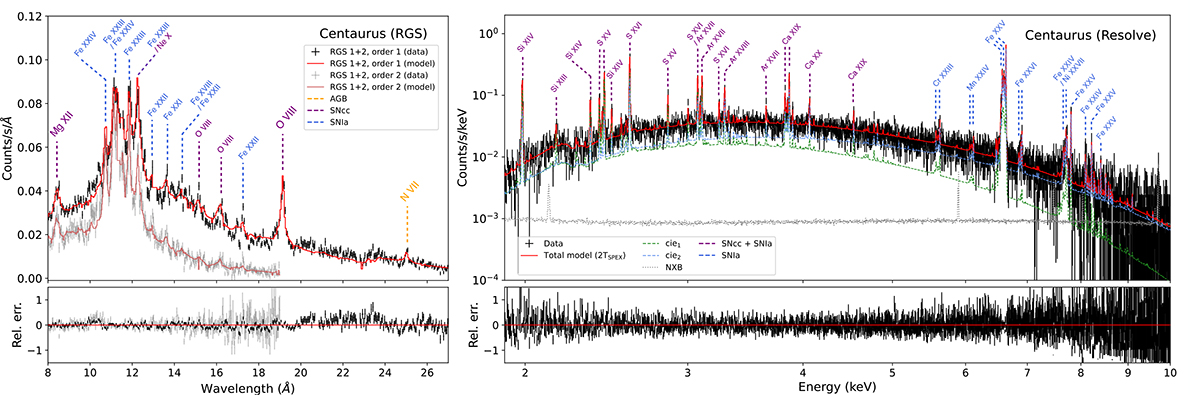
Fig. 2.
Download original image
Left: XMM-Newton/RGS first and second order spectra extracted with a 3′ cross-dispersion aperture (see Fig. 1). The RGS 1 and RGS 2 data are combined for clarity. Each order is fitted separately with a 2TSPEX model. Channels with significantly lower counts (originating from gaps in the detector plane) are accounted for in the fits but ignored in the plot for clarity. Right: XRISM/Resolve full-array spectrum fitted with a 2TSPEX model (Sect. 2.2.1) with the two thermal components and the NXB shown separately. A zoomed-in version of this plot is displayed in Fig. D.1. We also show the most prominent emission lines, colour-coded by their astrophysical origin: AGB (left panel only), SNcc and SNIa (both panels).
Current usage metrics show cumulative count of Article Views (full-text article views including HTML views, PDF and ePub downloads, according to the available data) and Abstracts Views on Vision4Press platform.
Data correspond to usage on the plateform after 2015. The current usage metrics is available 48-96 hours after online publication and is updated daily on week days.
Initial download of the metrics may take a while.