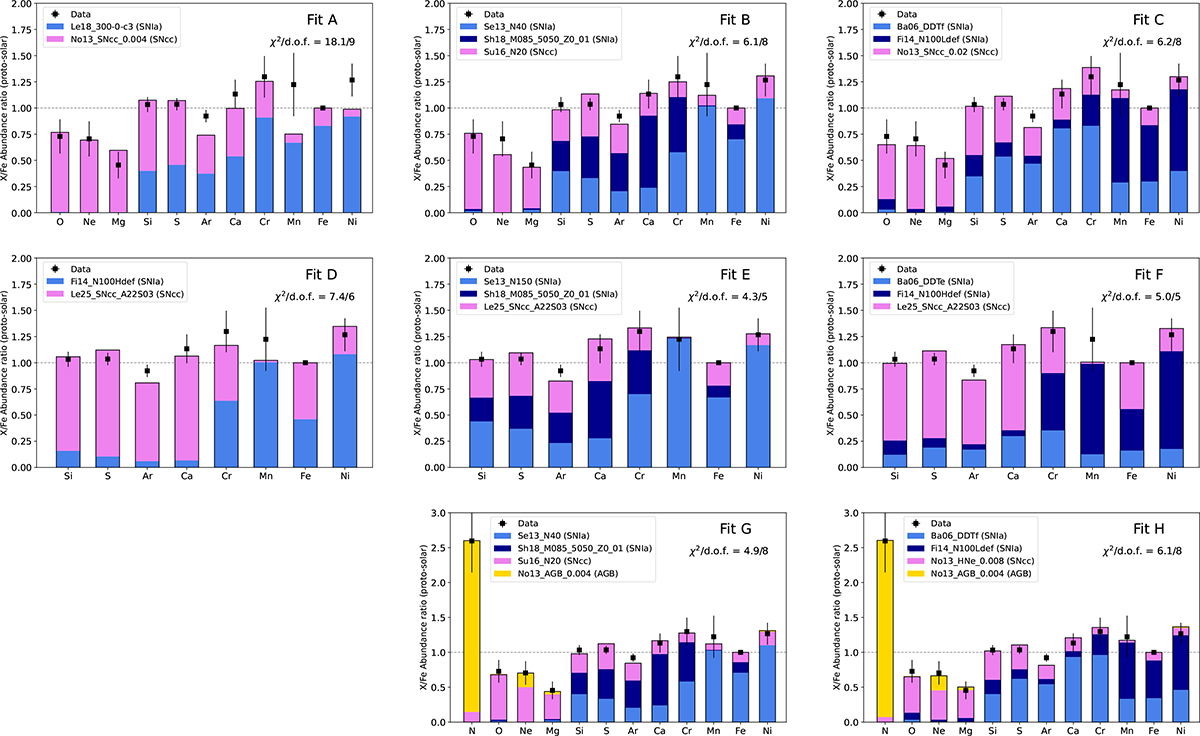
Fig. 9.
Download original image
Best-fit combination of AGB, SNcc, and/or SNIa yield models (coloured histograms) on our Centaurus final abundance pattern (black data points). AGB and SNcc contributions are yellow and pink, respectively. SNIa contributions are (light and dark) blue. Top panels (Fits A–C) are for all ratios except N/Fe and ignore the AGB contribution. Middle panels (Fits D–F) are for ratios measured with Resolve only. Bottom panels (Fits G, H) are for all ratios and include an AGB contribution. These fits are described further in the text (see also Table 6.
Current usage metrics show cumulative count of Article Views (full-text article views including HTML views, PDF and ePub downloads, according to the available data) and Abstracts Views on Vision4Press platform.
Data correspond to usage on the plateform after 2015. The current usage metrics is available 48-96 hours after online publication and is updated daily on week days.
Initial download of the metrics may take a while.