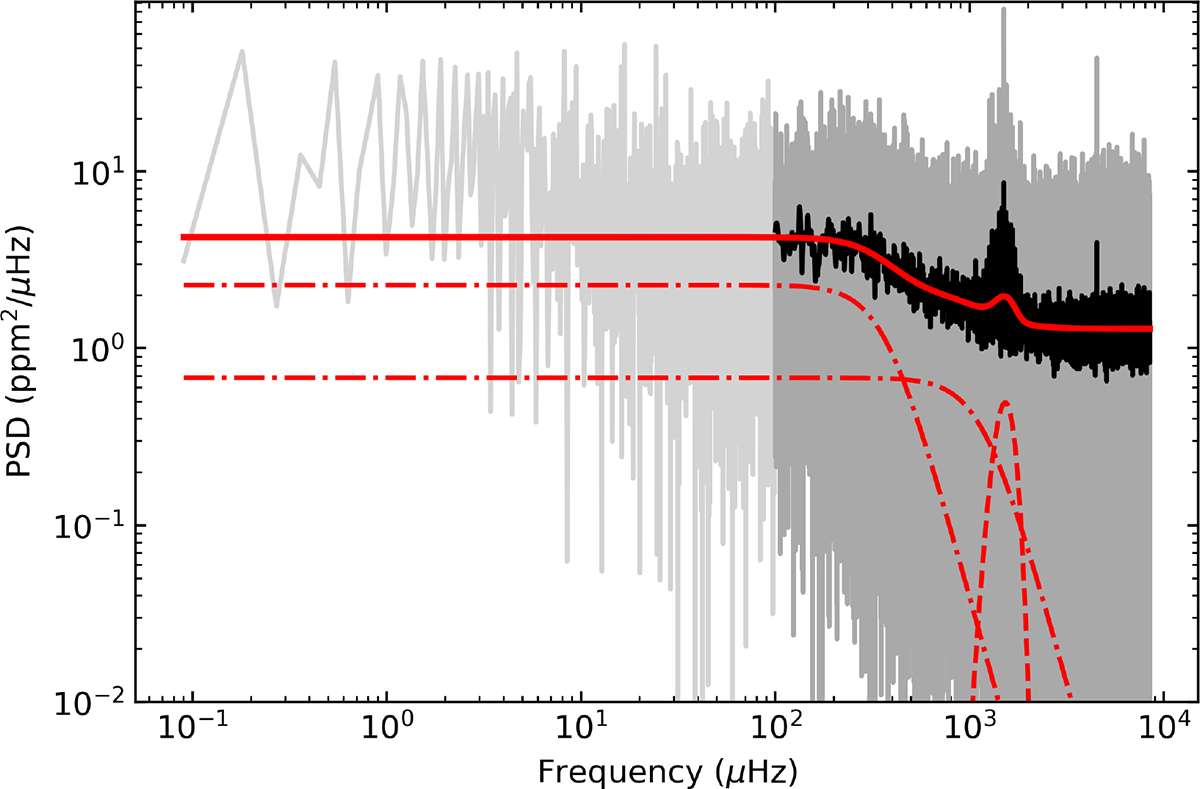
Fig. C.2.
Download original image
PSD of the primary of KIC 9693187. The multi-component fit to the PSD and (upper panel) and the power excess (lower panel) are shown. In the upper panel, the dash-dotted liens represent the background fits, while the dashed red line represents the gaussian fit. The solid line represents the combined fit to the PSD. The vertical dashes in the lower panel indicate the of the extracted radial (blue), dipole (dark red), and quadruple (orange). The solid red line depicts the combined solution of all extracted modes.
Current usage metrics show cumulative count of Article Views (full-text article views including HTML views, PDF and ePub downloads, according to the available data) and Abstracts Views on Vision4Press platform.
Data correspond to usage on the plateform after 2015. The current usage metrics is available 48-96 hours after online publication and is updated daily on week days.
Initial download of the metrics may take a while.