Fig. C.3.
Download original image
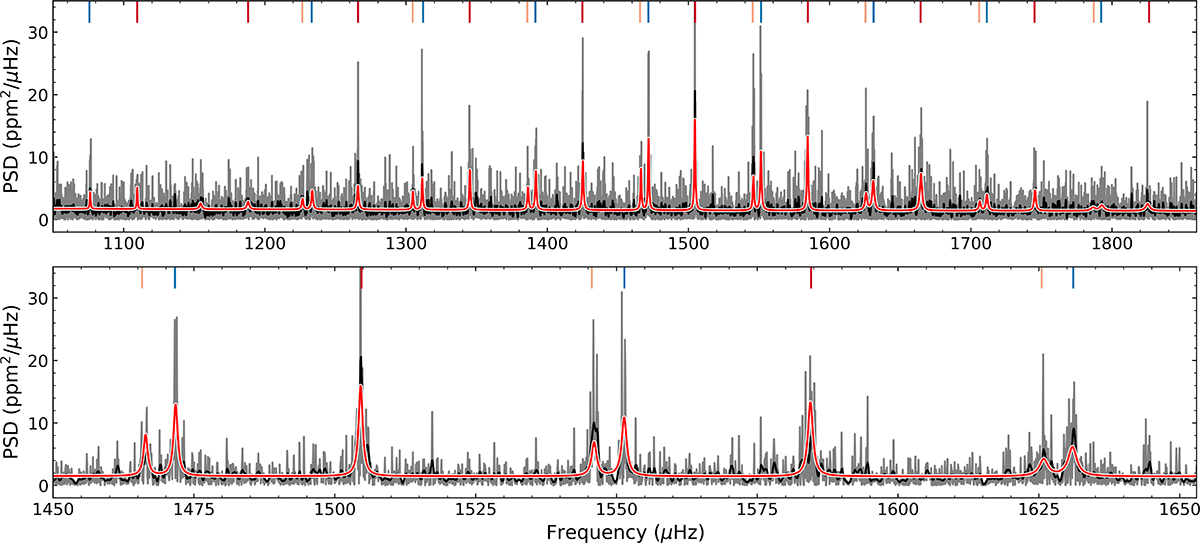
PSD of KIC 9693187 around the excess of power spectral density. The top panel shows the full power excess, with the original, and smoothed PSD in grey, and black, respectively. The lower provides a zoomed view on the two central radial orders. The red line depicts the combined model of extracted frequencies, which are represented by the vertical dashes (blue, red, and orange for ℓ = 0, 1, and 2, resp., see Table C.2).
Current usage metrics show cumulative count of Article Views (full-text article views including HTML views, PDF and ePub downloads, according to the available data) and Abstracts Views on Vision4Press platform.
Data correspond to usage on the plateform after 2015. The current usage metrics is available 48-96 hours after online publication and is updated daily on week days.
Initial download of the metrics may take a while.