Fig. C.4.
Download original image
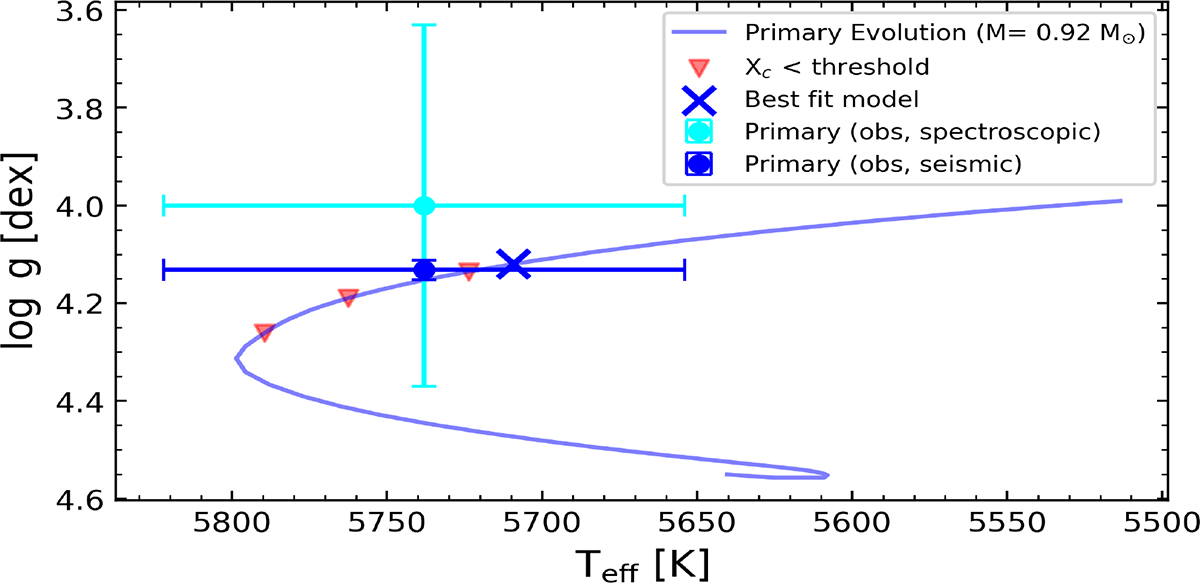
Kiel diagram of the primary of KIC 9693187. The spectroscopic and seismic log g are depicted for the primary. The evolutionary track of the MS and the subgiant phase is shown. The red triangles show when the fractional core-H content Xc drops below 1%, 0.01%, and 0.0001% and the blue cross gives the position of the best fit model.
Current usage metrics show cumulative count of Article Views (full-text article views including HTML views, PDF and ePub downloads, according to the available data) and Abstracts Views on Vision4Press platform.
Data correspond to usage on the plateform after 2015. The current usage metrics is available 48-96 hours after online publication and is updated daily on week days.
Initial download of the metrics may take a while.