Fig. 10.
Download original image
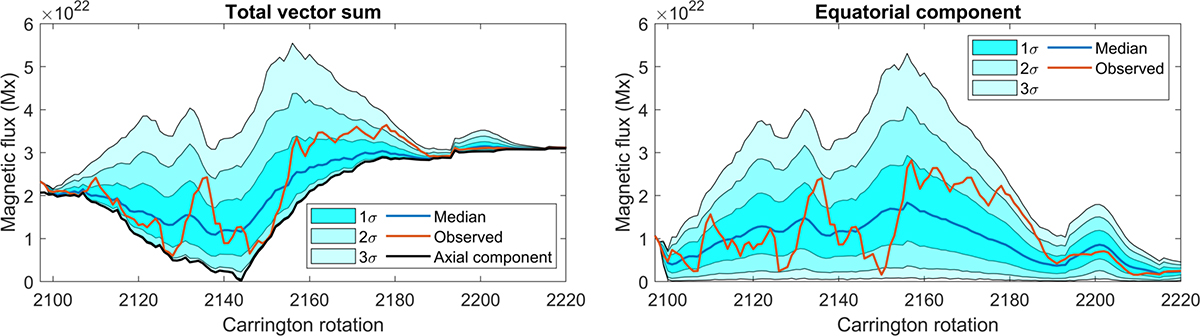
Simulations of large-scale magnetic field with uniformly random longitudes. Left: Vector sum magnitude. Right: Equatorial component of the vector sum. The blue line shows the median dipole strength from 104 simulations. The orange line shows the result from the original simulation. Shaded regions show the 1σ–3σ ranges from the simulations. The black line in the left panel shows the strength of the axial component.
Current usage metrics show cumulative count of Article Views (full-text article views including HTML views, PDF and ePub downloads, according to the available data) and Abstracts Views on Vision4Press platform.
Data correspond to usage on the plateform after 2015. The current usage metrics is available 48-96 hours after online publication and is updated daily on week days.
Initial download of the metrics may take a while.