Fig. 5.
Download original image
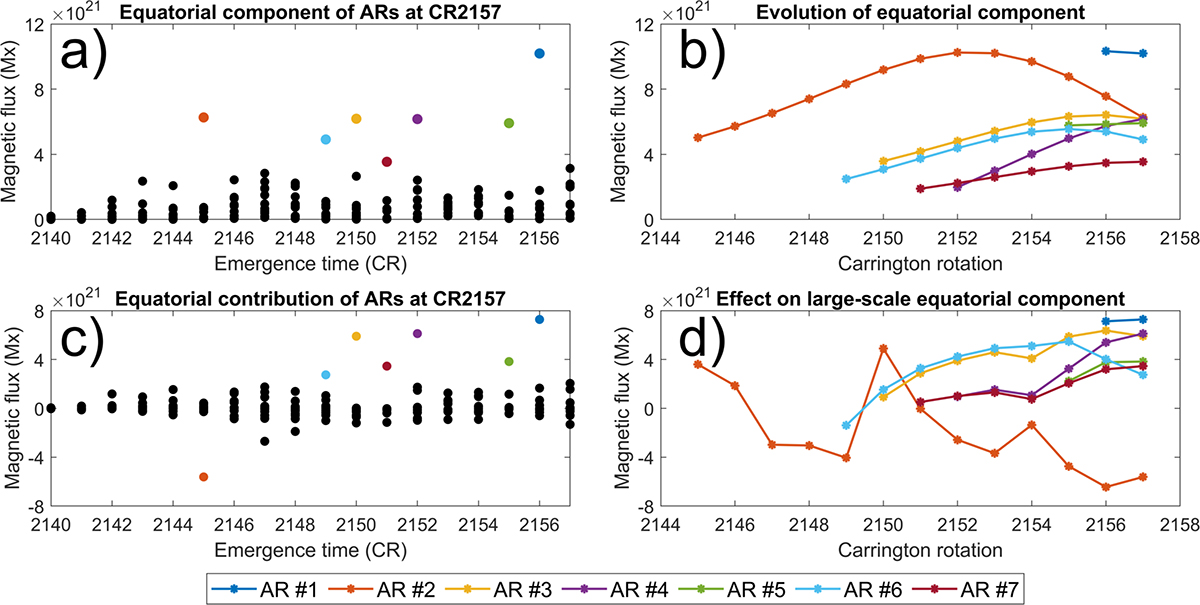
Equatorial components of active regions. (a) Equatorial component at CR2157 vs. time of emergence. (b) Evolution of equatorial components of seven active regions which had strongest equatorial component at CR2157. (c) Projections of the active region equatorial components along the large-scale field at CR2157. (d) Evolution of contributions of seven active regions which had strongest equatorial component at CR2157. Colors mark the seven active regions that had the strongest equatorial component at CR2157 and correspond to same active regions in all panels.
Current usage metrics show cumulative count of Article Views (full-text article views including HTML views, PDF and ePub downloads, according to the available data) and Abstracts Views on Vision4Press platform.
Data correspond to usage on the plateform after 2015. The current usage metrics is available 48-96 hours after online publication and is updated daily on week days.
Initial download of the metrics may take a while.