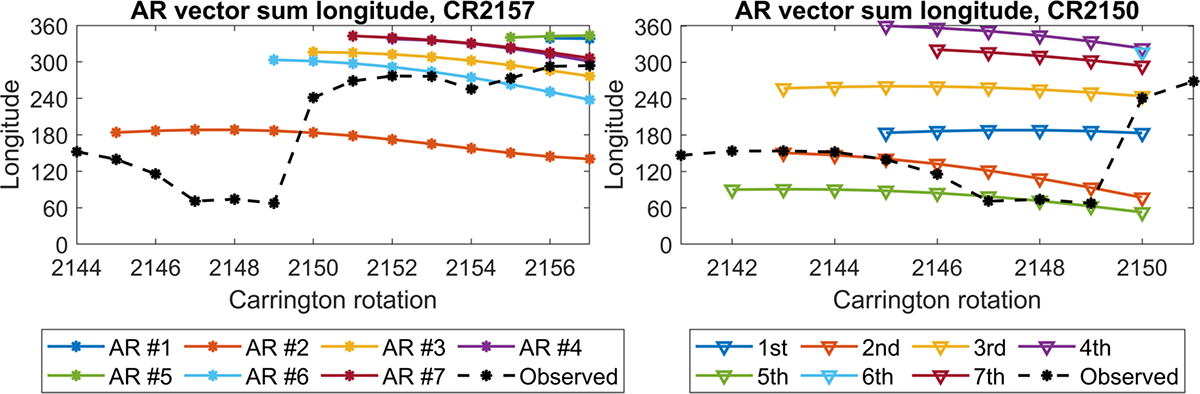
Fig. 6.
Download original image
Evolution of active regions vector sum longitude. Left: Active regions that had strongest equatorial component at CR2157. Colors mark the same regions as in Fig. 5. Right: Active regions that had strongest equatorial component at CR2150. The dashed black line shows the location of vector sum longitude of the large-scale field.
Current usage metrics show cumulative count of Article Views (full-text article views including HTML views, PDF and ePub downloads, according to the available data) and Abstracts Views on Vision4Press platform.
Data correspond to usage on the plateform after 2015. The current usage metrics is available 48-96 hours after online publication and is updated daily on week days.
Initial download of the metrics may take a while.