Fig. 9.
Download original image
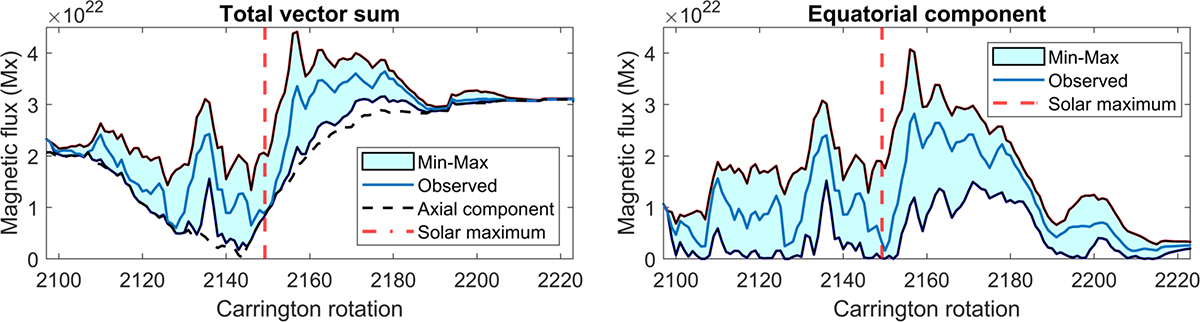
Minimum and maximum vector sum resulting from shifting a single active region in longitude. Left: Total vector sum. Right: Equatorial component of the vector sum. The shaded region shows the minimum-maximum range. The solid blue line shows the unaltered simulation. The red dashed line shows the location of the solar maximum (CR2149, April 2014, SILSO 13-month smoothed mean). The dashed black line in the left panel shows the strength of the axial component.
Current usage metrics show cumulative count of Article Views (full-text article views including HTML views, PDF and ePub downloads, according to the available data) and Abstracts Views on Vision4Press platform.
Data correspond to usage on the plateform after 2015. The current usage metrics is available 48-96 hours after online publication and is updated daily on week days.
Initial download of the metrics may take a while.