Fig. 2
Download original image
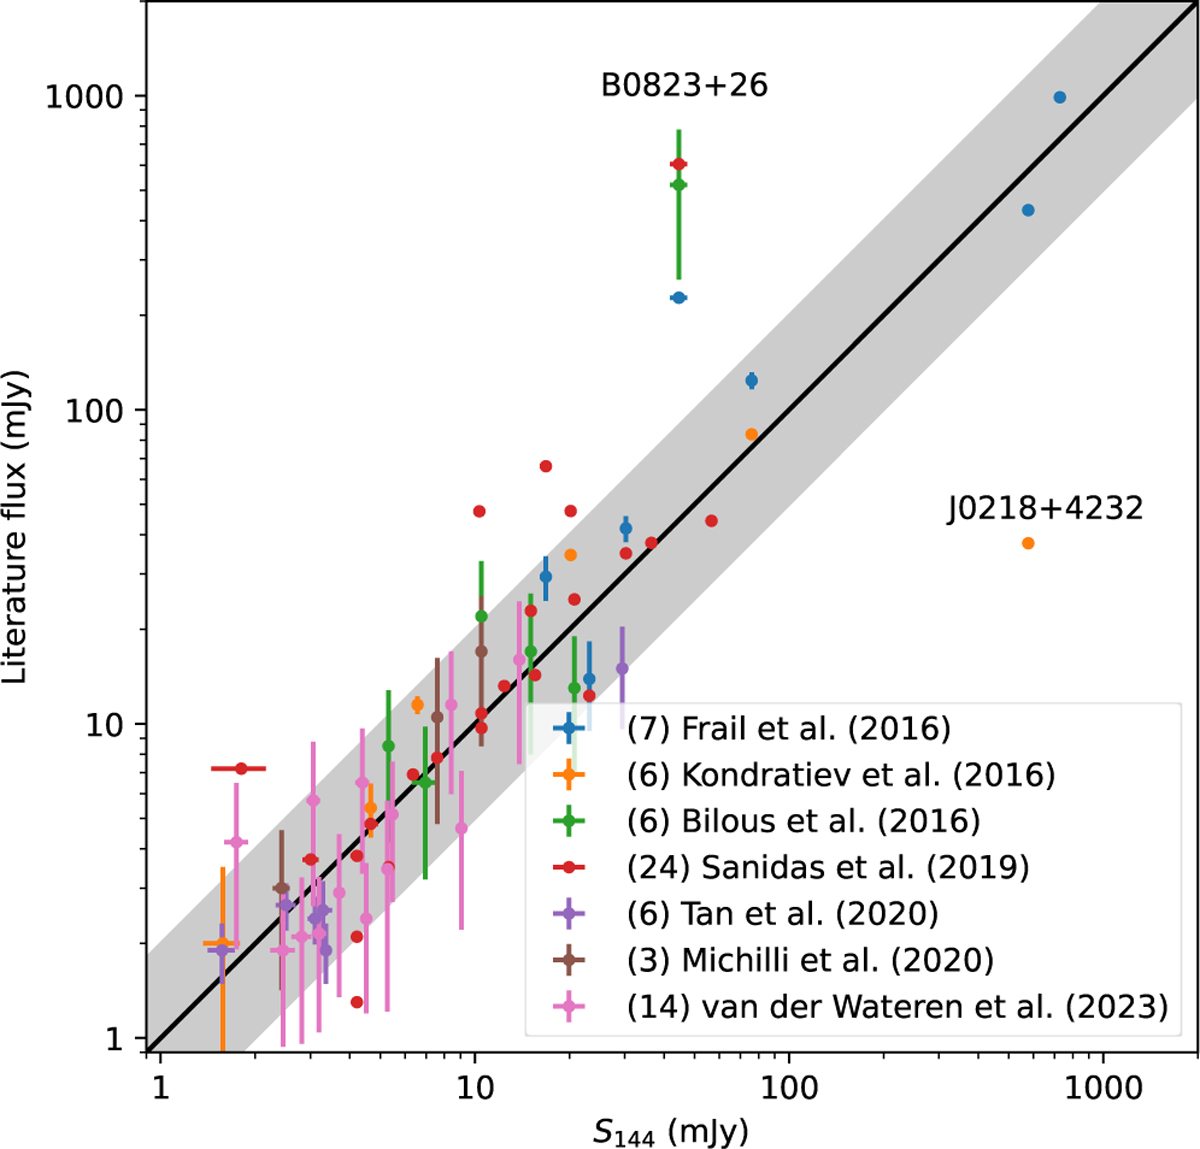
Comparison of LoTSS flux densities from Table A.1 at 144 MHz (horizontal) to 150 MHz flux density measurements from image-domain observations by Frail et al. (2016) and time-domain observations by Bilous et al. (2016), Kondratiev et al. (2016), Tan et al. (2020), Michilli et al. (2020), van der Wateren et al. (2023), and Sanidas et al. (2019) at 135 MHz. The grey region represent fluxes ratios between factors 0.5 and 2.
Current usage metrics show cumulative count of Article Views (full-text article views including HTML views, PDF and ePub downloads, according to the available data) and Abstracts Views on Vision4Press platform.
Data correspond to usage on the plateform after 2015. The current usage metrics is available 48-96 hours after online publication and is updated daily on week days.
Initial download of the metrics may take a while.