Fig. 4
Download original image
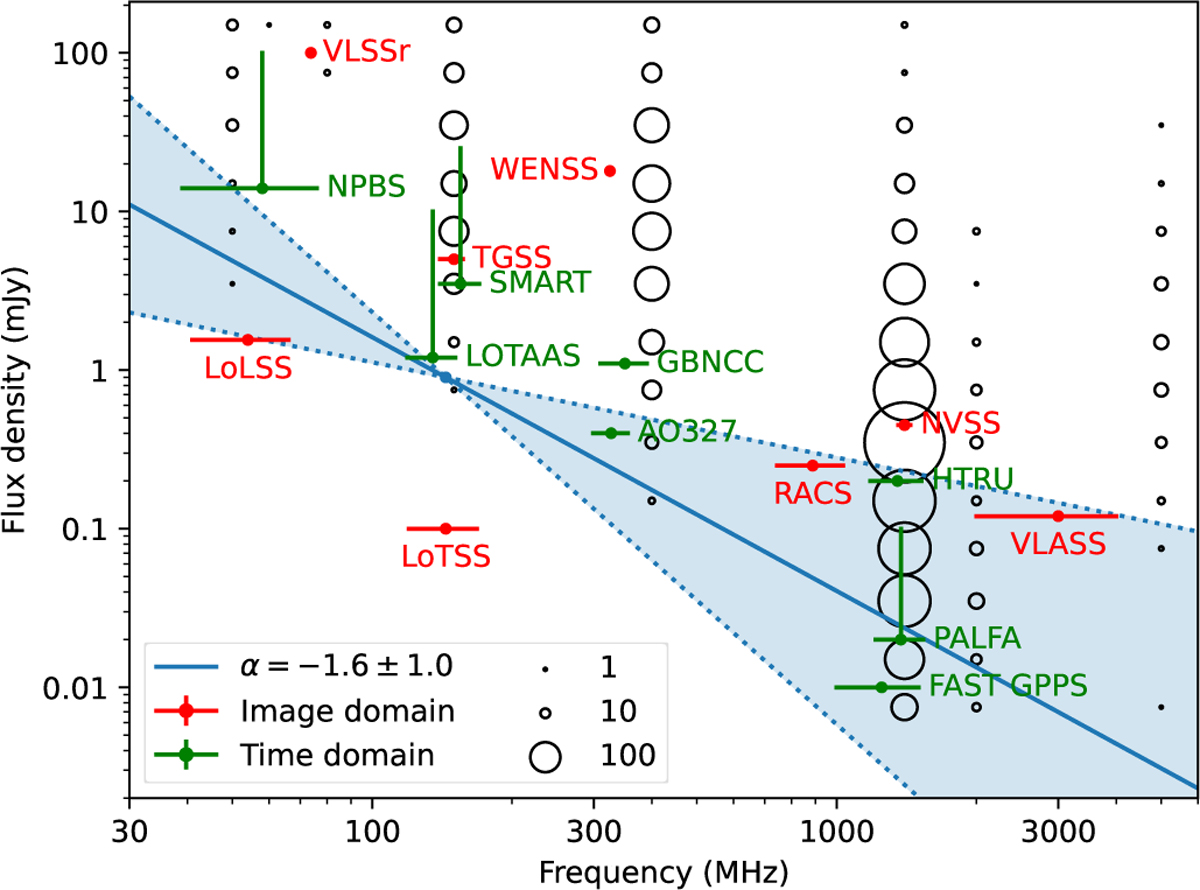
Comparison of survey sensitivity and frequency coverage of various time-domain pulsar surveys (green) and wide-area continuum image-domain surveys (red) against distributions of pulsar flux density measurements from the pulsar catalogue (open circles). An example power-law spectrum Sν ∝ να with a = −1.6 ± 1.0 for S144 = 0.9 mJy is shown for reference. (References: NPBS; Brionne et al. 2025, LOTAAS; Sanidas et al. 2019, SMART; Bhat et al. 2023, AO327; Deneva et al. 2013, GBNCC; Stovall et al. 2014, FAST GPPS; Han et al. 2021, PALFA; Cordes et al. 2006, HTRU; Keith et al. 2010, LoLSS; de Gasperin et al. 2021, VLSSr; Lane et al. 2014, LoTSS; Shimwell et al. 2017, TGSS; Intema et al. 2017, WENSS; Rengelink et al. 1997, RACS; McConnell et al. 2020, NVSS; Condon et al. 1998, VLASS; Lacy et al. 2020).
Current usage metrics show cumulative count of Article Views (full-text article views including HTML views, PDF and ePub downloads, according to the available data) and Abstracts Views on Vision4Press platform.
Data correspond to usage on the plateform after 2015. The current usage metrics is available 48-96 hours after online publication and is updated daily on week days.
Initial download of the metrics may take a while.