Fig. 3
Download original image
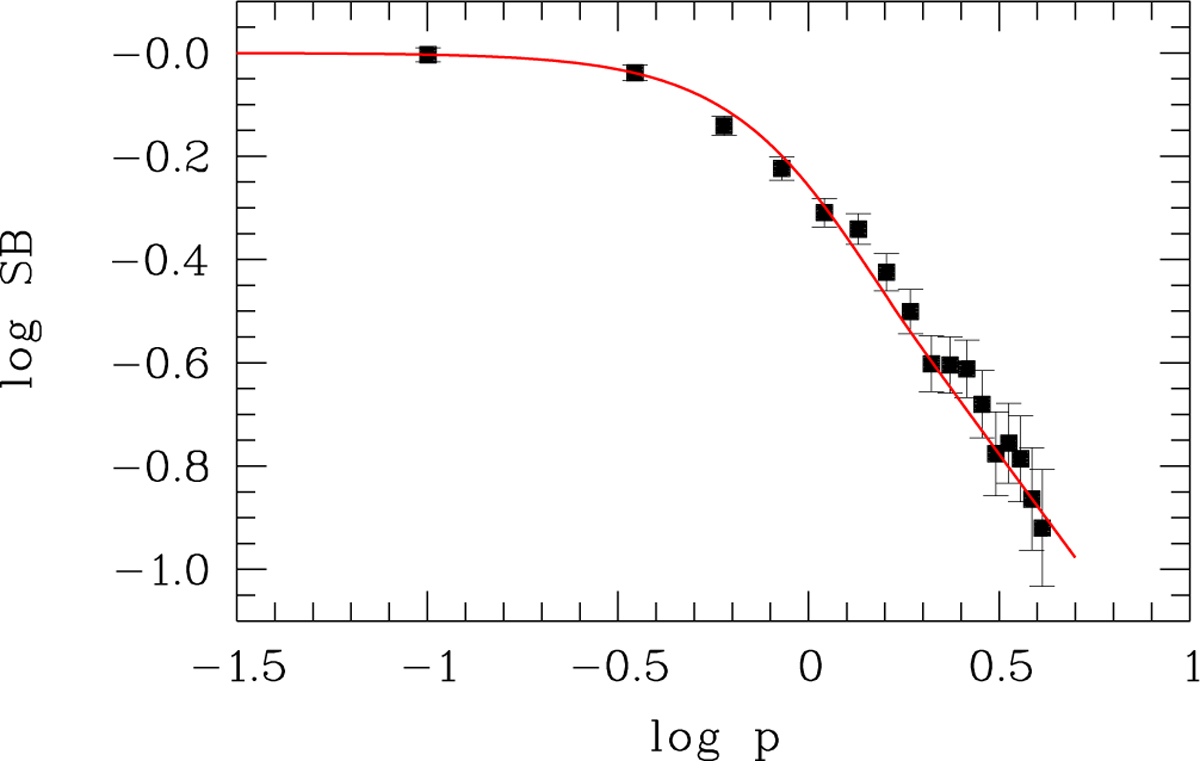
Spatial profile of the brightest NiI line (λ3458 Å) observed with UVES on September 4. The measured surface brightness (SB; normalized to one at the photocenter) is plotted as a function of the projected nucleocentric distance, p, in arcsec. The red line represents SB ∝ p−1 convolved with a 1.5" full-width-at-half-maximum Gaussian to account for the seeing and tracking imperfections.
Current usage metrics show cumulative count of Article Views (full-text article views including HTML views, PDF and ePub downloads, according to the available data) and Abstracts Views on Vision4Press platform.
Data correspond to usage on the plateform after 2015. The current usage metrics is available 48-96 hours after online publication and is updated daily on week days.
Initial download of the metrics may take a while.