Fig. 7
Download original image
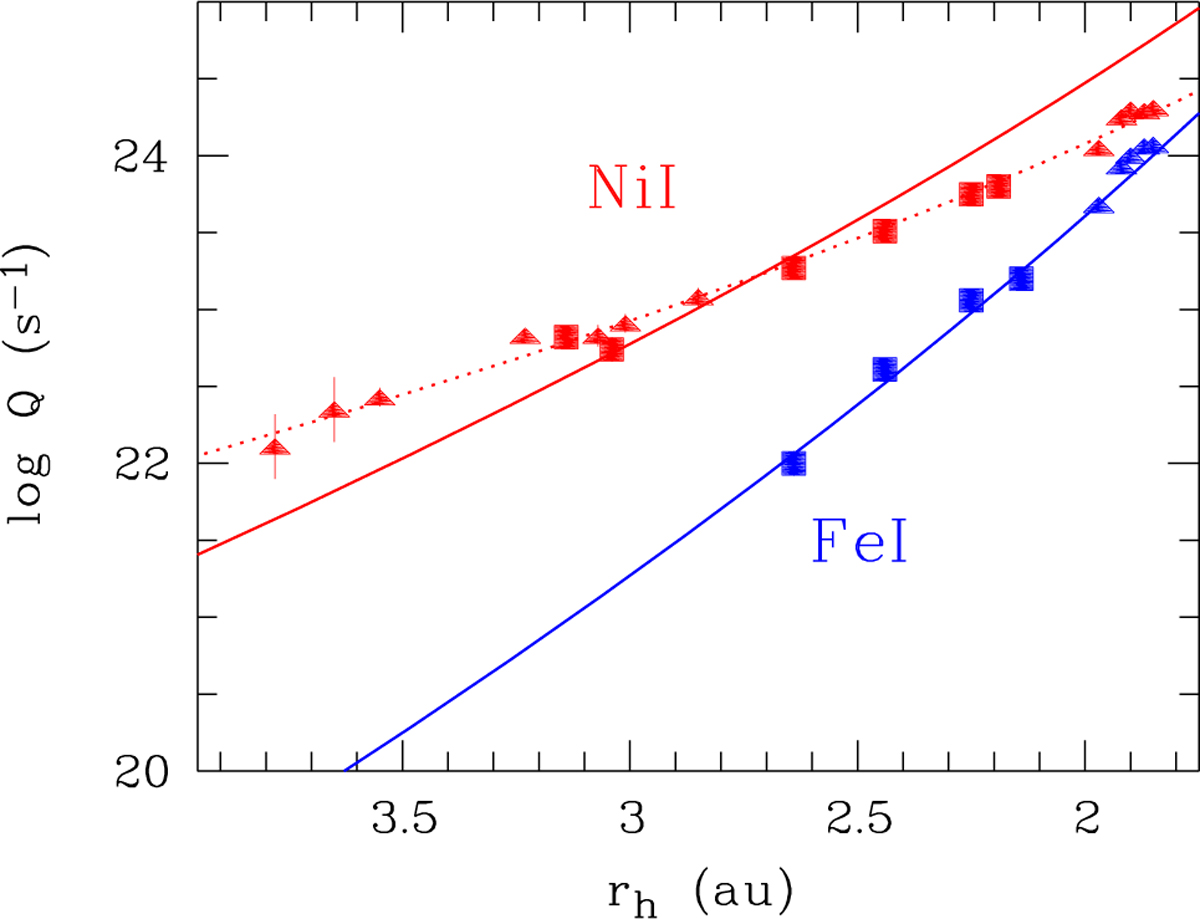
Q(NiI) and Q(FeI) production rates in comet 3I as a function of the heliocentric distance. Squares represent UVES measurements and triangles X-shooter measurements. The curves show the production rates of NiI (in red) and FeI (in blue), which were obtained by multiplying the sublimation rates of the Ni(CO)4 and Fe(CO)5 carbonyls by the effective emitting area of each species (see text). For the solid curves, the sublimation rates were computed assuming T = 280 rh−1/2. For the dotted red curve, the sublimation rate was computed assuming T = 237 rh−1/3 for Ni(CO)4.
Current usage metrics show cumulative count of Article Views (full-text article views including HTML views, PDF and ePub downloads, according to the available data) and Abstracts Views on Vision4Press platform.
Data correspond to usage on the plateform after 2015. The current usage metrics is available 48-96 hours after online publication and is updated daily on week days.
Initial download of the metrics may take a while.