Open Access
Fig. B.1
Download original image
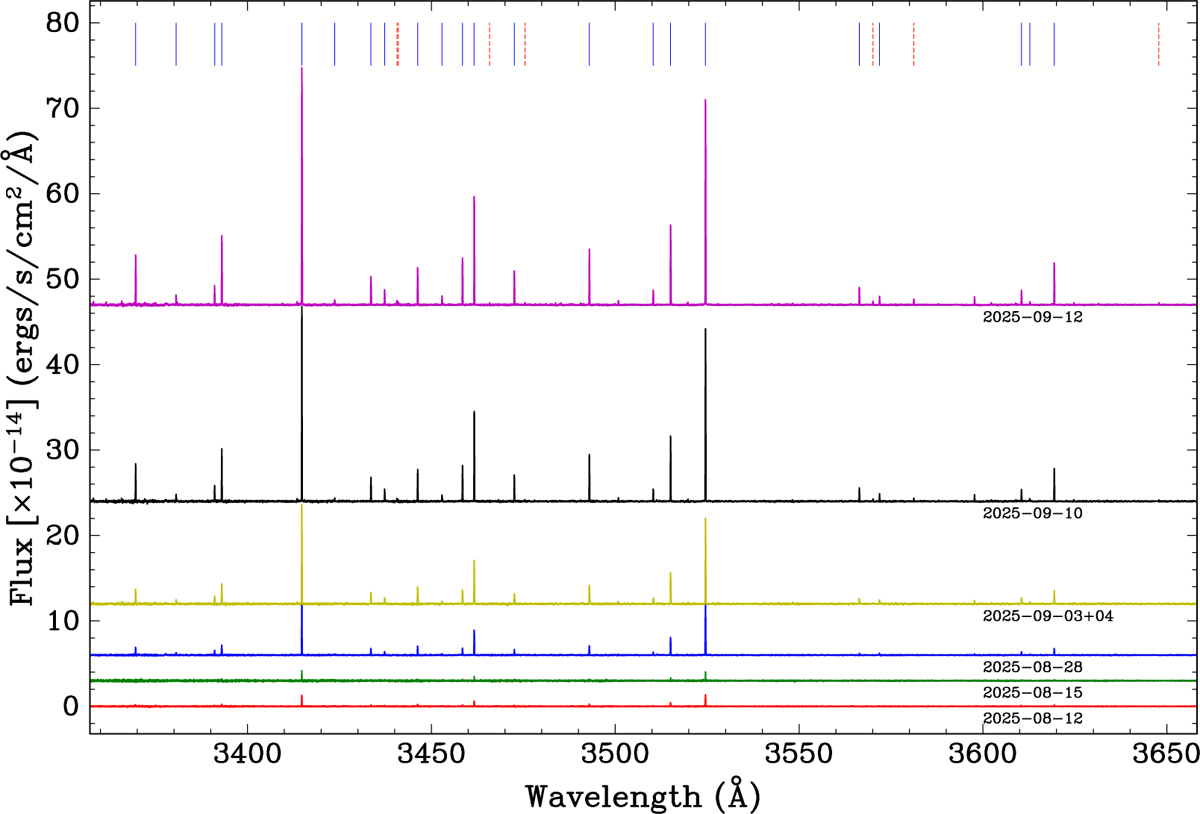
UVES blue, continuum-subtracted, spectra of comet 3I from August 12 to September 12. They show the evolution of the NiI (solid blue tickmarks) and FeI lines (dashed red tickmarks) in the spectral range 3360-3650 Å. The flux scale is identical for all spectra, which are shifted vertically for clarity.
Current usage metrics show cumulative count of Article Views (full-text article views including HTML views, PDF and ePub downloads, according to the available data) and Abstracts Views on Vision4Press platform.
Data correspond to usage on the plateform after 2015. The current usage metrics is available 48-96 hours after online publication and is updated daily on week days.
Initial download of the metrics may take a while.