Fig. E.1
Download original image
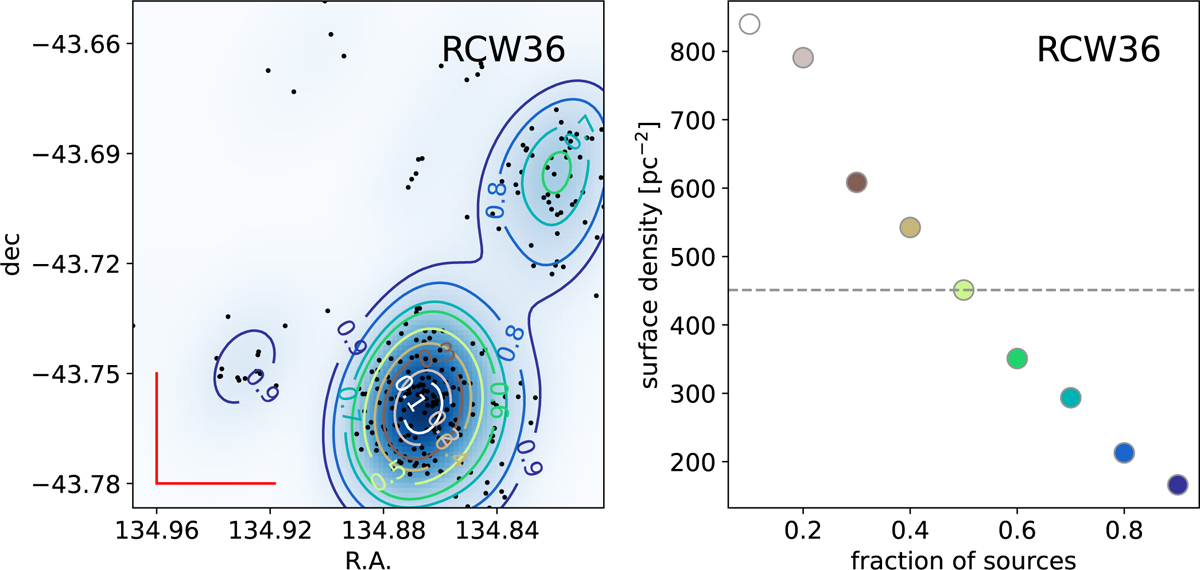
Spatial distribution for the set of sources in our HAWK-I data with membership weight probabilities higher than 80%. The color maps are two-dimensional KDEs of the candidate member distributions, and the contours represent the levels containing different percentages of the sources (10% to 90%, in steps of 10%). The stellar surface density for the area contained inside each contour are shown to the right of the KDE plot. The surface density associated with the 50% contour are marked by the horizontal dashed lines. The red bars shown in the lower right corner represent the 0.5 pc scale at the distance of RCW 36.
Current usage metrics show cumulative count of Article Views (full-text article views including HTML views, PDF and ePub downloads, according to the available data) and Abstracts Views on Vision4Press platform.
Data correspond to usage on the plateform after 2015. The current usage metrics is available 48-96 hours after online publication and is updated daily on week days.
Initial download of the metrics may take a while.