Fig. G.1
Download original image
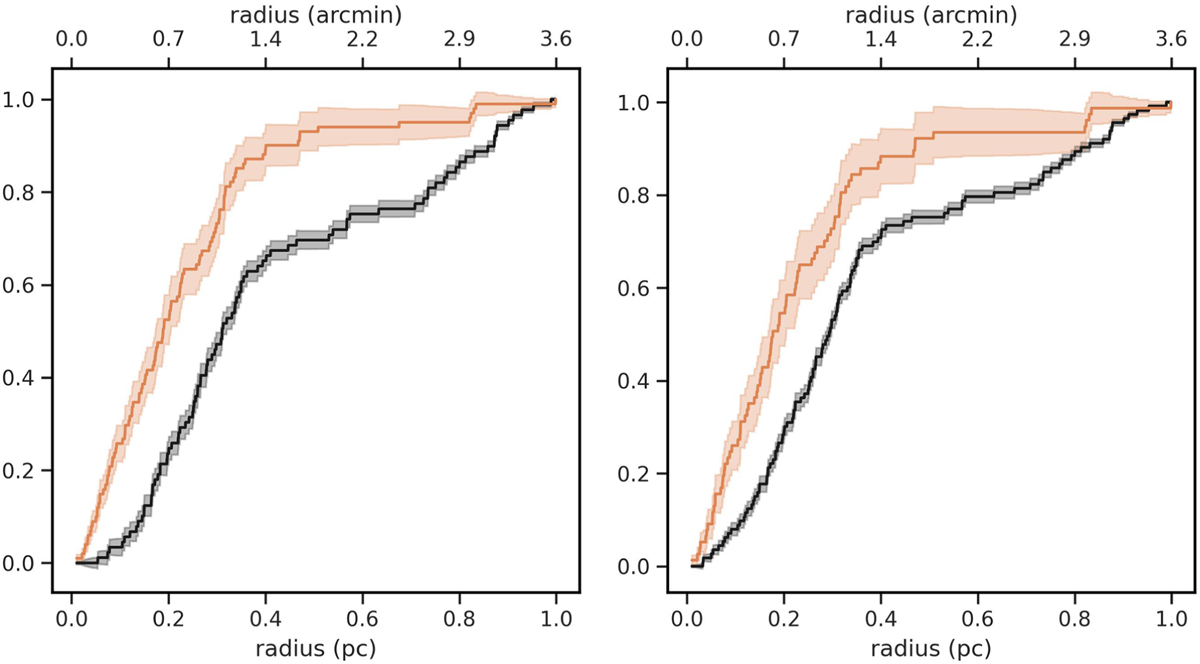
Cumulative mass functions for the set of sources in our HAWK-I data with membership weights larger than 80% corresponding probability. Orange and grey regions trace the variability from 100 different mass sampled from the PDFs presented and described in Section 6 of the main body, which are bootstrapped with repetition another 100 times. In dark orange and black the cumulative curves calculated from the median masses are shown for the different mass regimes. On the left, we test the amount of sources with masses between 0.20M⊙ < M < 0.5M⊙ against sources with masses higher than 0.5M⊙. On the right, the same test is redone for masses between 0.20M⊙ < M < 1.0M⊙ and masses higher than 1.0M⊙.
Current usage metrics show cumulative count of Article Views (full-text article views including HTML views, PDF and ePub downloads, according to the available data) and Abstracts Views on Vision4Press platform.
Data correspond to usage on the plateform after 2015. The current usage metrics is available 48-96 hours after online publication and is updated daily on week days.
Initial download of the metrics may take a while.