Fig. 2
Download original image
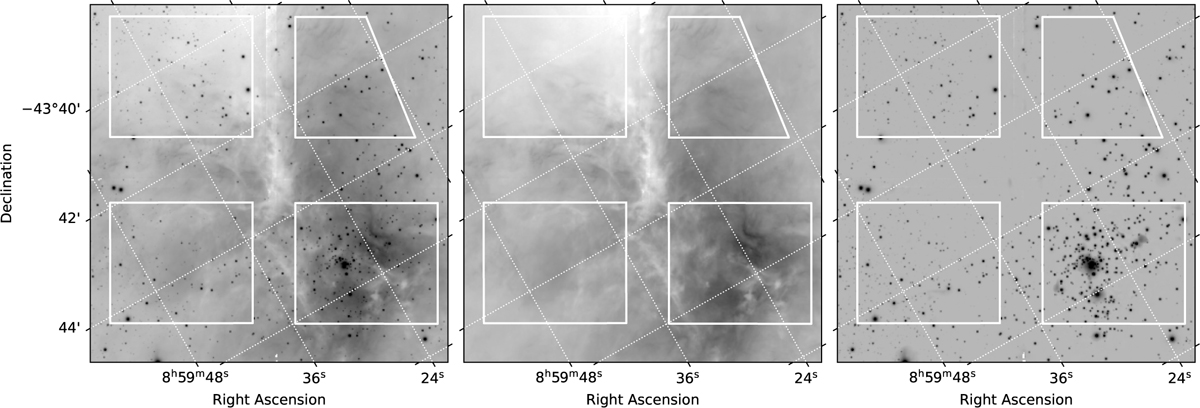
Left: original HAWK-I J-band image of RCW 36. Centre: HAWK-I J-band image with only the nebular component. Right: HAWK-I J-band image with only the point sources (hereby called denebulised). The white contours trace the regions used in the present analysis; the different contour in chip 3 is due to the artefact described in Section 2. The dotted lines refer to the coordinate grid lines of constant right ascension or declination.
Current usage metrics show cumulative count of Article Views (full-text article views including HTML views, PDF and ePub downloads, according to the available data) and Abstracts Views on Vision4Press platform.
Data correspond to usage on the plateform after 2015. The current usage metrics is available 48-96 hours after online publication and is updated daily on week days.
Initial download of the metrics may take a while.