Fig. 4
Download original image
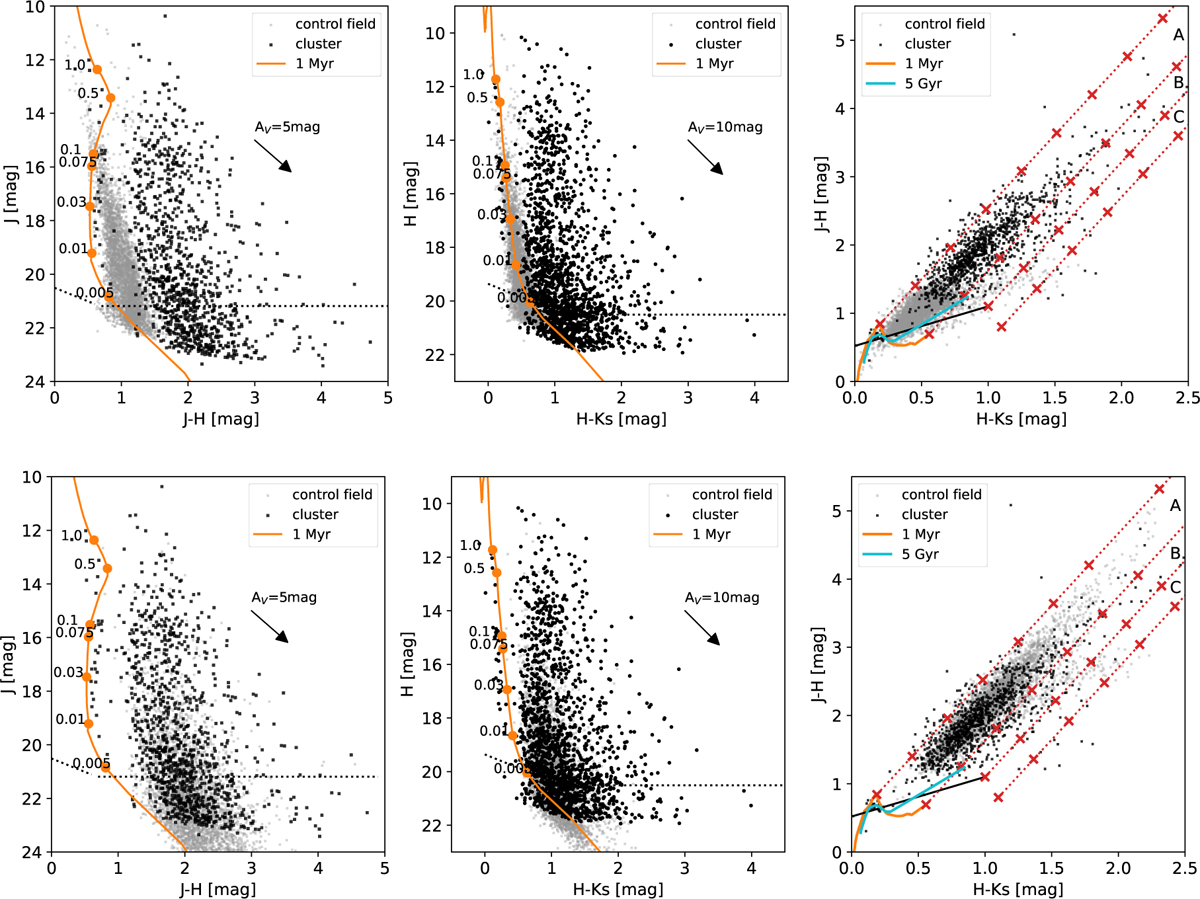
Colour–magnitude diagrams of J, J − H (left) and H, H − Ks (middle), and J − H, H − Ks colour–colour diagram (right) of the sources detected toward RCW 36 (black dots) and the control field (grey dots). The orange line shows the 1 Myr isochrone shifted to the distance of 950 pc, while the cyan solid line in the right-most panels represents the 5 Gyr isochrone used to estimate the extinction of the control field. The dotted red lines in the CCDs show the reddening vectors, and the red crosses along the reddening lines mark AV = 0–40 mag, in step of 5 mag. The black dotted lines mark the average 90% completeness limit of the photometry. The solid black line represents the T Tauri loci from Meyer et al. (1997). The letter A refers to the region of giants and dwarfs, the letter B refers to the T Tauri region and finally the C region refers to the Herbig AeBe region (Hernández et al. 2005). The upper panels show original control field photometry, and the lower ones contain control field photometry reddened to match the distribution of the extinction in the cluster field (see Section 5.1).
Current usage metrics show cumulative count of Article Views (full-text article views including HTML views, PDF and ePub downloads, according to the available data) and Abstracts Views on Vision4Press platform.
Data correspond to usage on the plateform after 2015. The current usage metrics is available 48-96 hours after online publication and is updated daily on week days.
Initial download of the metrics may take a while.