Fig. 6
Download original image
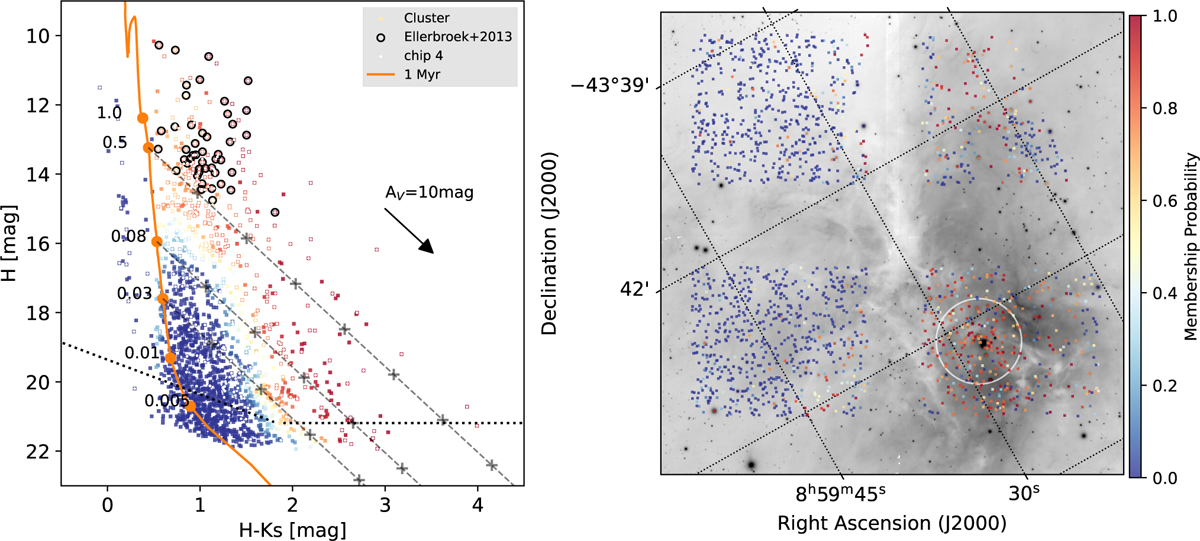
Colour-magnitude diagram (left) and the on-sky distribution (right) of the sources in our JHKs catalogue. The colour scheme represents the membership weights computed in Section 5.2 as a probability. The orange solid line in the left panel is the 1 Myr isochrone, the dotted line refers to the 50% completeness limit for chip 4, and the dashed lines mark the position of a 0.5 M⊙, 0.08 M⊙ and 0.03 M⊙ source at different extinctions. The plus signs mark the AV=[10, 20, 30, 40, 50, 60] mag. The black circles identify the 50 spectroscopically confirmed members from Ellerbroek et al. (2013). The white dots identify the sources which are located within HAWK-I chip 4, in which the cluster is centred on. The white circle on the right is a visual representation of the inner region employed for the IMF shown in the bottom of Figure 7 and discussed in Section 10.
Current usage metrics show cumulative count of Article Views (full-text article views including HTML views, PDF and ePub downloads, according to the available data) and Abstracts Views on Vision4Press platform.
Data correspond to usage on the plateform after 2015. The current usage metrics is available 48-96 hours after online publication and is updated daily on week days.
Initial download of the metrics may take a while.