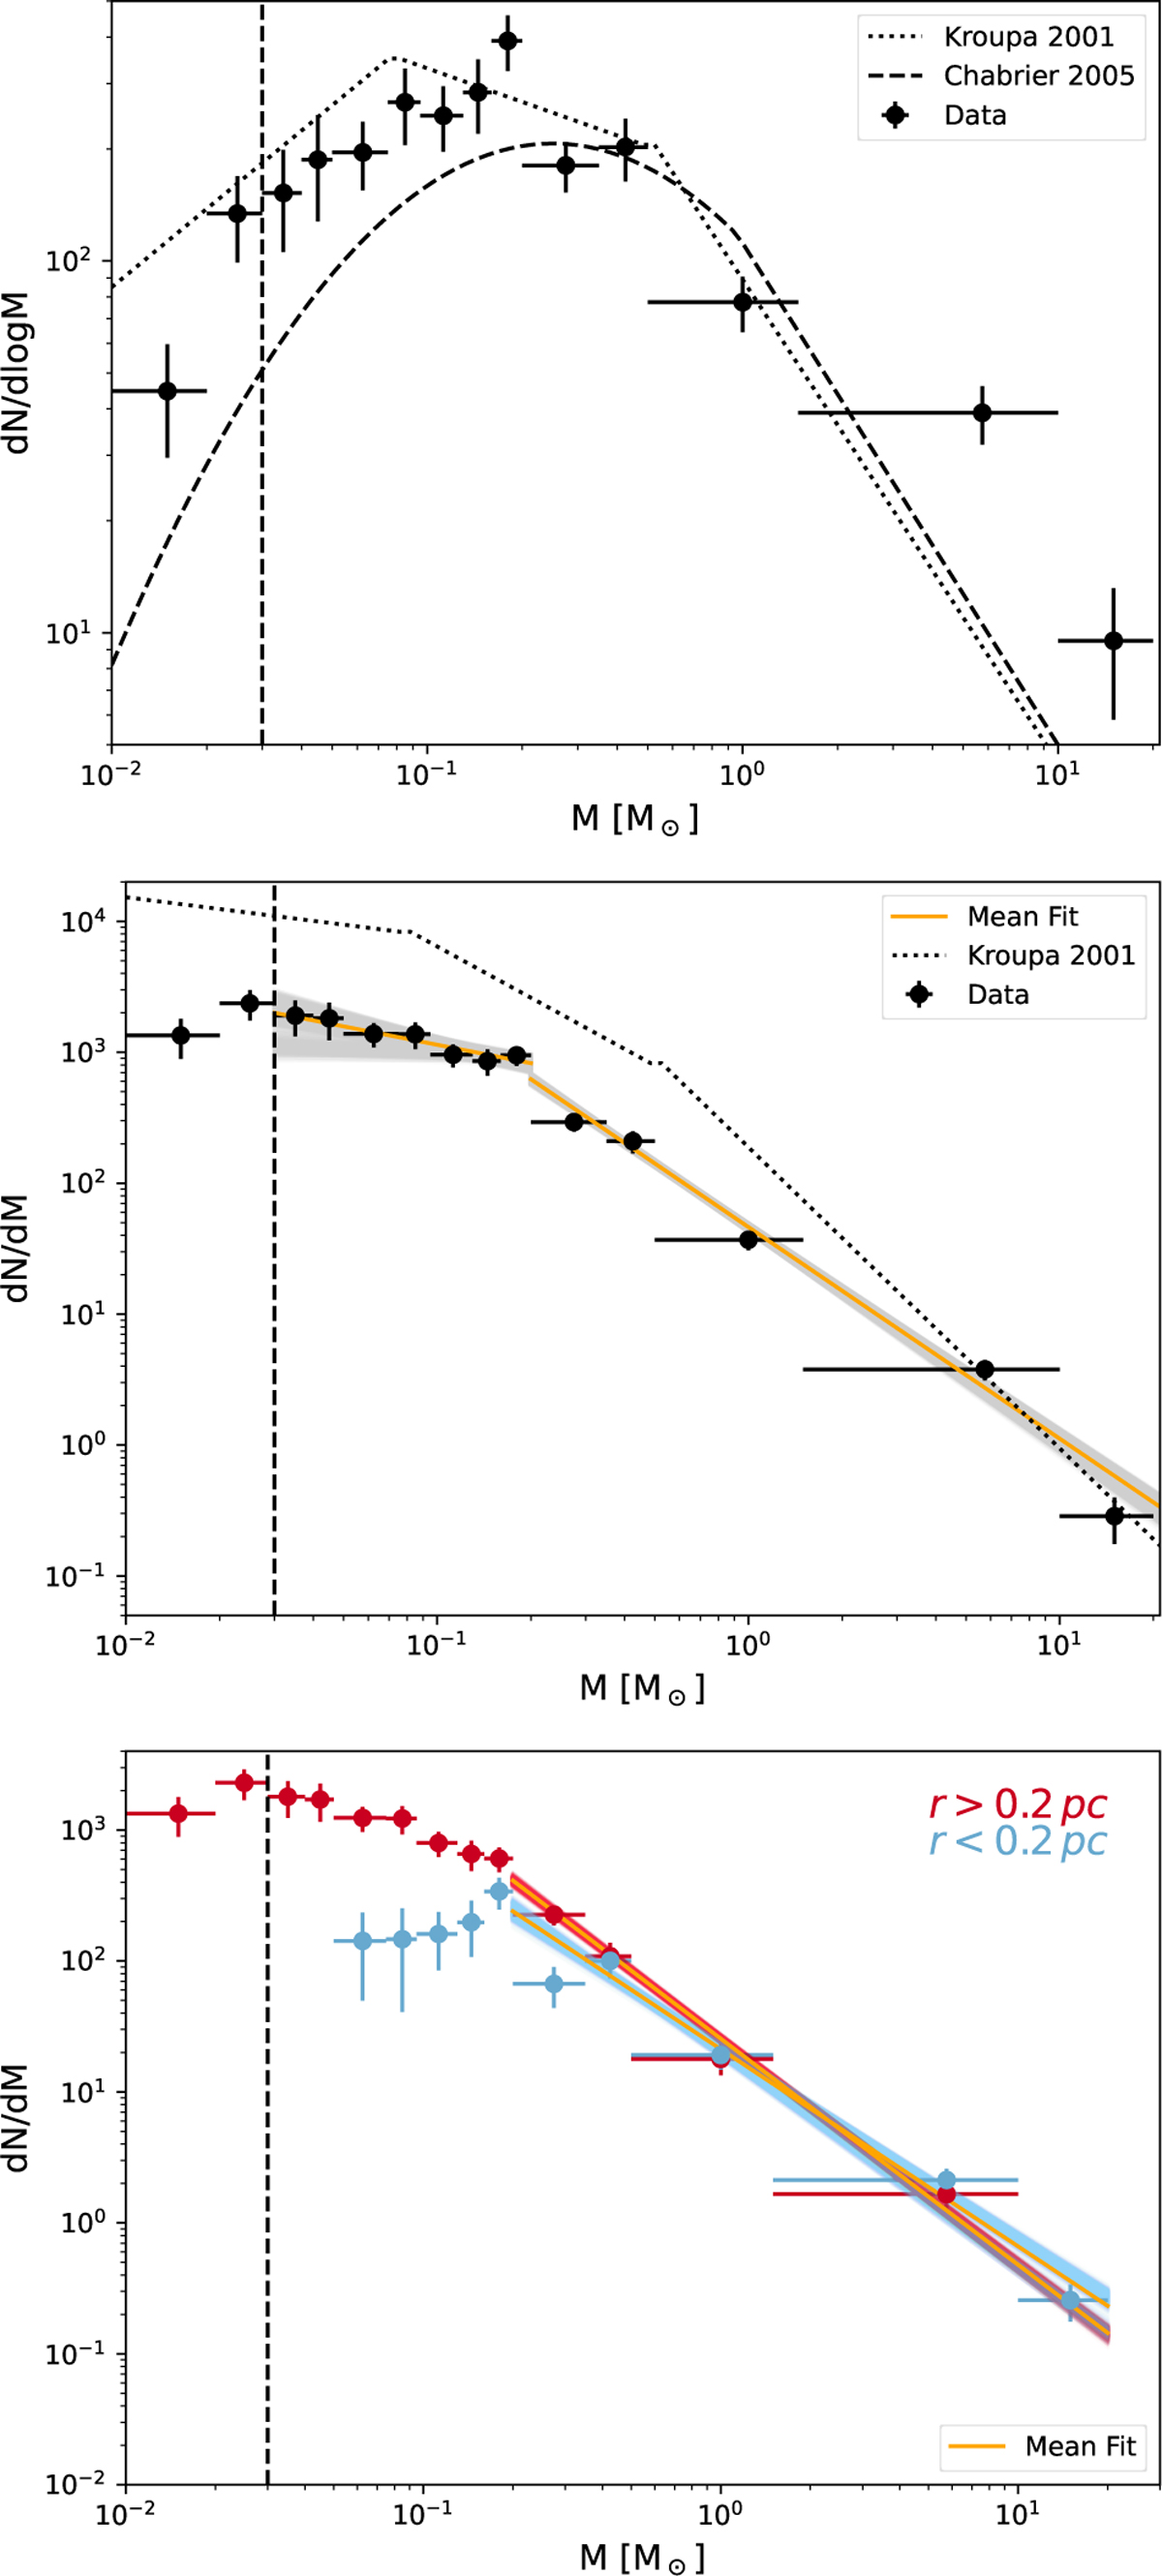
Fig. 7
Download original image
Completeness-corrected IMFs (up to 50% limit) of RCW 36. The vertical dashed line in all plots refers to the completeness limit assuming AV < 12 mag (see discussion in Section 8.2). The vertical solid error bars are the mean 1σ computed for each bin, while the horizontal solid error bars refer to the bin widths. In the top plot we present the dNdlogM form of the IMF in contrast to the Chabrier (2005) IMF (dashed black curve) and the Kroupa (2001) IMF (dot-dashed curve). In the centre plot, we present the results from the broken power law fits described in Section 8, with the orange line referring to the weighted mean α (dNdM ∝ M−α) obtained from the distribution for all member lists. The distribution of slopes obtained is also shown as the grey area in the centre plot. In the bottom plot, we present the two IMFs obtained for the sources within (white circle in Figure 6) and outside a 0.2pc radius from the centre of the cluster. The red (outer region) and blue (inner region) areas in the bottom plot represent the whole distribution of the obtained α. Bins that included no sources in at least one of the member lists were removed from the plots.
Current usage metrics show cumulative count of Article Views (full-text article views including HTML views, PDF and ePub downloads, according to the available data) and Abstracts Views on Vision4Press platform.
Data correspond to usage on the plateform after 2015. The current usage metrics is available 48-96 hours after online publication and is updated daily on week days.
Initial download of the metrics may take a while.