Fig. B.2
Download original image
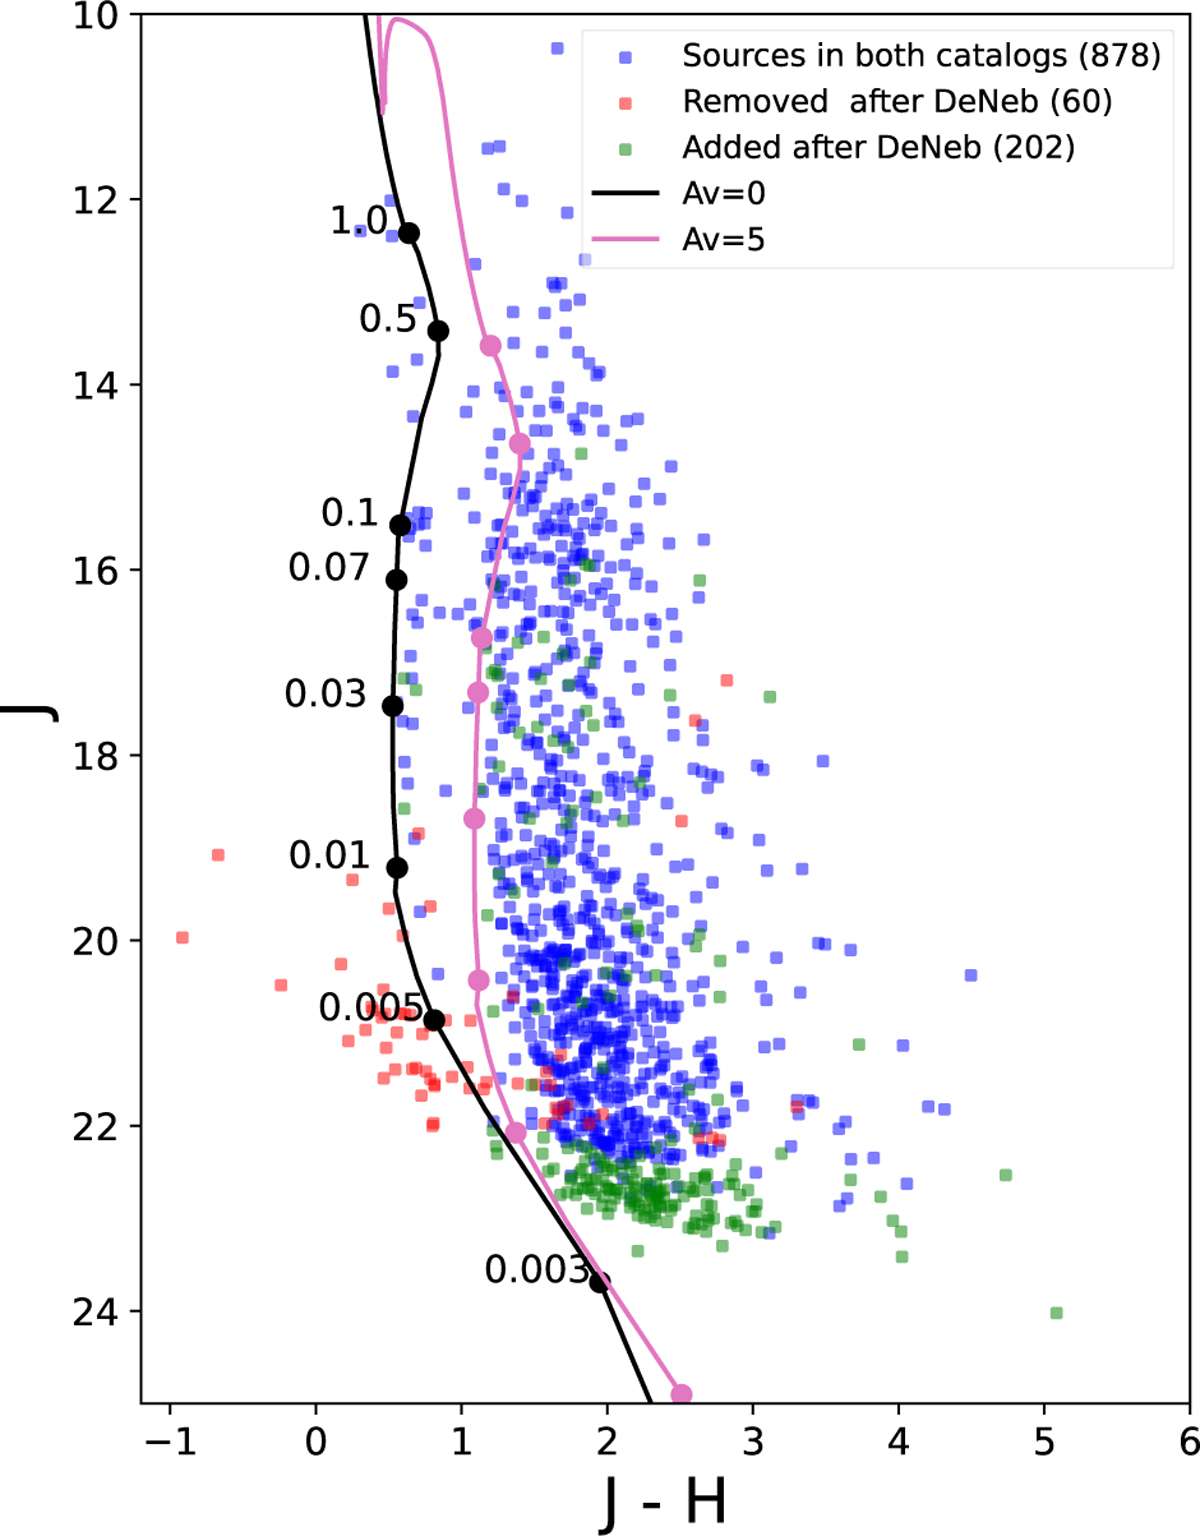
J, J − H CMD showcasing the photometry of the different populations of sources explained in Appendix B and showcased in Figure B.1. The red points refer back to the sources identified only in the original images, while the green points refer back to the sources only identified in the denebulised images. The blue points are the sources which appear on both the original and denebulised images. The black curve is the unreddened 1 Myr isochrone plotted for a distance of 950 pc, while the magenta curve is the same isochrone plotted for the same distance and AV = 5 mag.
Current usage metrics show cumulative count of Article Views (full-text article views including HTML views, PDF and ePub downloads, according to the available data) and Abstracts Views on Vision4Press platform.
Data correspond to usage on the plateform after 2015. The current usage metrics is available 48-96 hours after online publication and is updated daily on week days.
Initial download of the metrics may take a while.