Fig. 1
Download original image
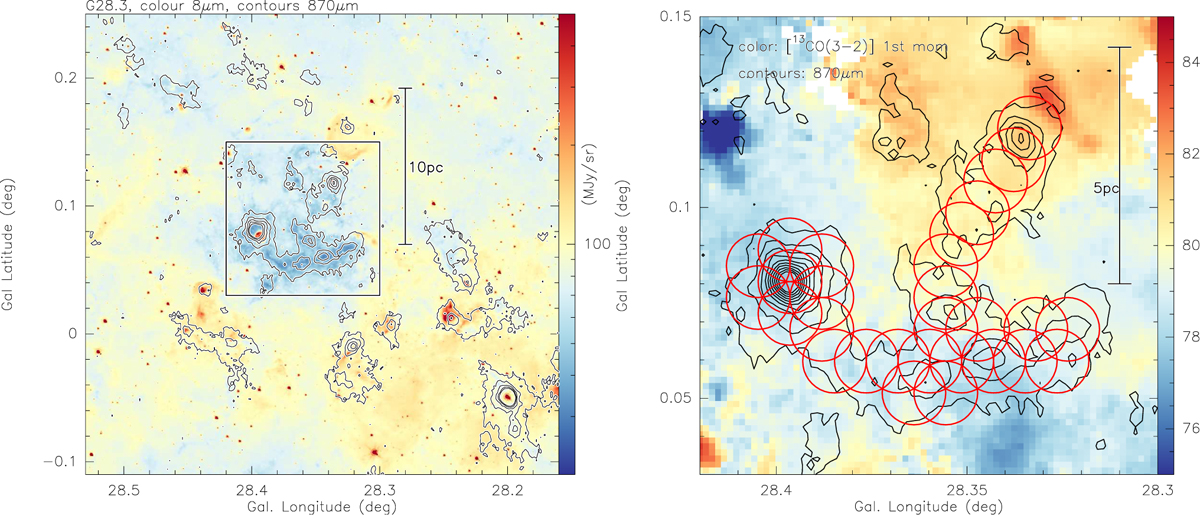
Overview of the G28 region. Left panel: color scale showing GLIMPSE 8 μm emission (Churchwell et al. 2009) for the G28 IRDC. The contours show the corresponding ATLASGaL 870 μm dust continuum emission, starting at 4σ (200 mJy beam−1) (Schuller et al. 2009) and continuing in 8σ steps. The box outlines the area shown to the right. Right panel: zoom into the G28 target region. The color scale presents the velocity field (first moment) km s−1 observed in 13CO(3–2) with APEX (Beuther et al. 2020). The contours show the 870 μm continuum emission from the ATLASGAL survey (Schuller et al. 2009). The red circles outline the observed NOEMA mosaic. A scale bar is shown to the right in both panels.
Current usage metrics show cumulative count of Article Views (full-text article views including HTML views, PDF and ePub downloads, according to the available data) and Abstracts Views on Vision4Press platform.
Data correspond to usage on the plateform after 2015. The current usage metrics is available 48-96 hours after online publication and is updated daily on week days.
Initial download of the metrics may take a while.