Fig. 2
Download original image
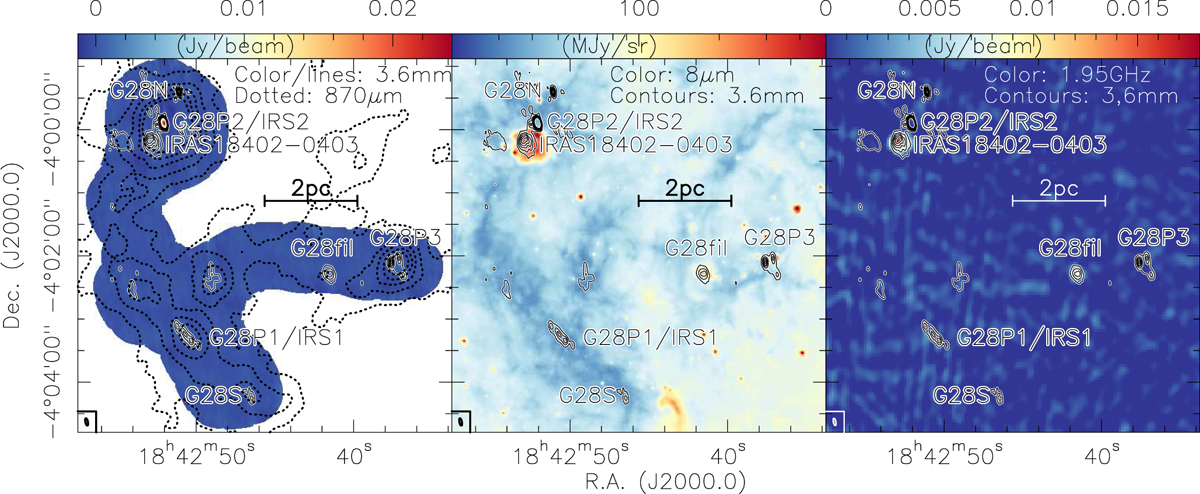
Continuum images of the G28 IRDC. Color scale and solid contours showing the NOEMA 3 mm continuum emission. Contour levels range from 0.4 to 1.6 mJy beam–1 (1σ 0.1 mJy beam−1). The dotted contours show 870 μm single-dish continuum data (ATLASGAL, Schuller et al. 2009) starting at 0.15 Jy beam−1 and continuing in steps of 0.3 Jy beam−1 up to 1.5 Jy beam−1 (1σ 0.05 Jy beam−1 ). Middle: color scale showing the Spitzer 8 μm emission (2″ resolution, Churchwell et al. 2009) with 3 mm emission overlaid as contours. Right: color scale showing the 1.95 GHz continuum emission from the THOR survey (10.6″ × 9.0″ resolution, Beuther et al. 2016; Wang et al. 2020) with 3 mm emission overlaid as contours. All panels show a scale bar and the NOEMA synthesized beam. Source labels follow Carey et al. (2000), Wang et al. (2008); G28N and G28fil are newly labeled here.
Current usage metrics show cumulative count of Article Views (full-text article views including HTML views, PDF and ePub downloads, according to the available data) and Abstracts Views on Vision4Press platform.
Data correspond to usage on the plateform after 2015. The current usage metrics is available 48-96 hours after online publication and is updated daily on week days.
Initial download of the metrics may take a while.