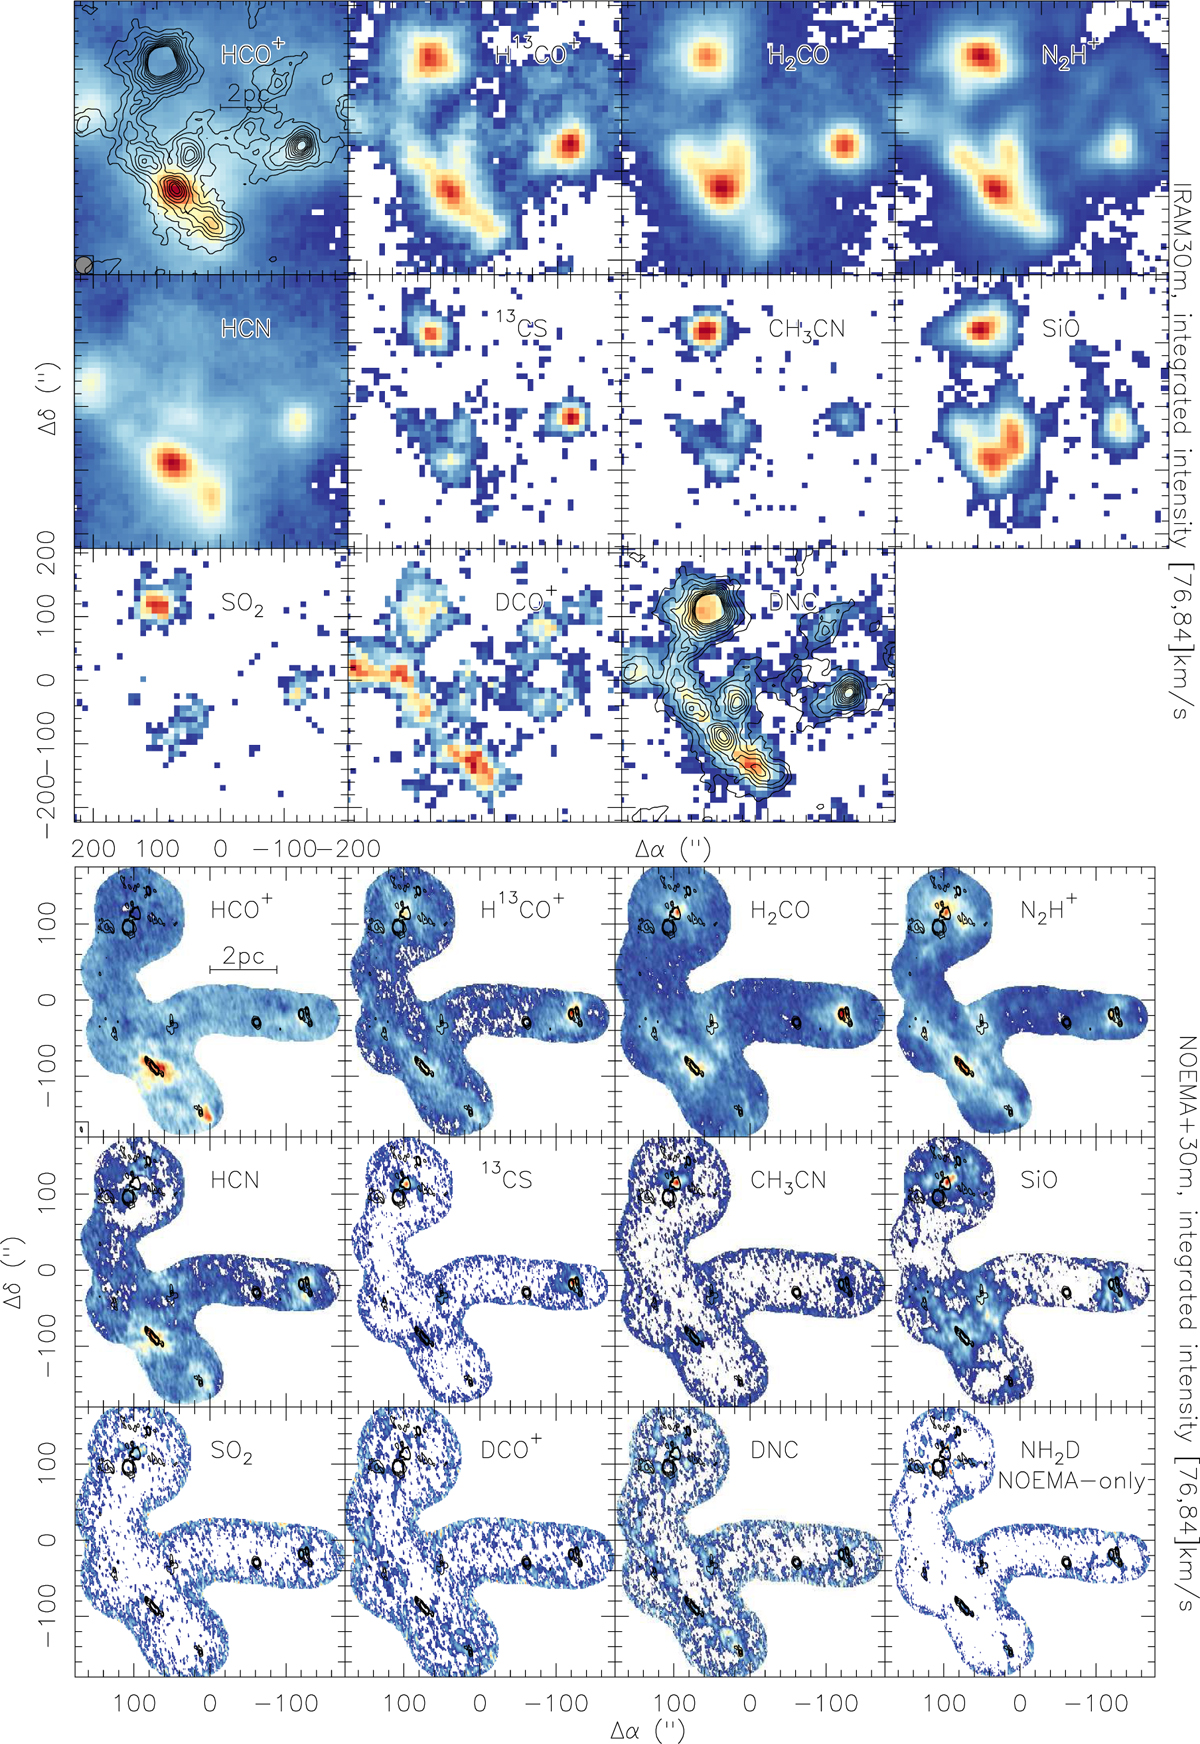
Fig. 5
Download original image
Integrated intensity data for G28. Top: 30m observations. Bottom: Merged NOEMA+30 m data (except NH2D, which shows NOEMA-only data as that line was not covered by the 30m observations). The integration range is 76–84 km s−1. All maps were created by clipping the data below the 3σ level; intensity levels were chosen for each panel separately to better highlight the emission features. The contours on the 30m data show 870 μm continuum (Schuller et al. 2009) in 3σ steps of 0.15 Jy beam−1. The contours on the NOEMA+30m data show the NOEMA-only 3.6mm continuum from 0.4 to 1.6mJy beam−1 (1σ ~ 0.1 mJy beam−1). Molecules are labeled in all panels, and the beam and scale bar are shown in the top-left panels.
Current usage metrics show cumulative count of Article Views (full-text article views including HTML views, PDF and ePub downloads, according to the available data) and Abstracts Views on Vision4Press platform.
Data correspond to usage on the plateform after 2015. The current usage metrics is available 48-96 hours after online publication and is updated daily on week days.
Initial download of the metrics may take a while.