Fig. 7
Download original image
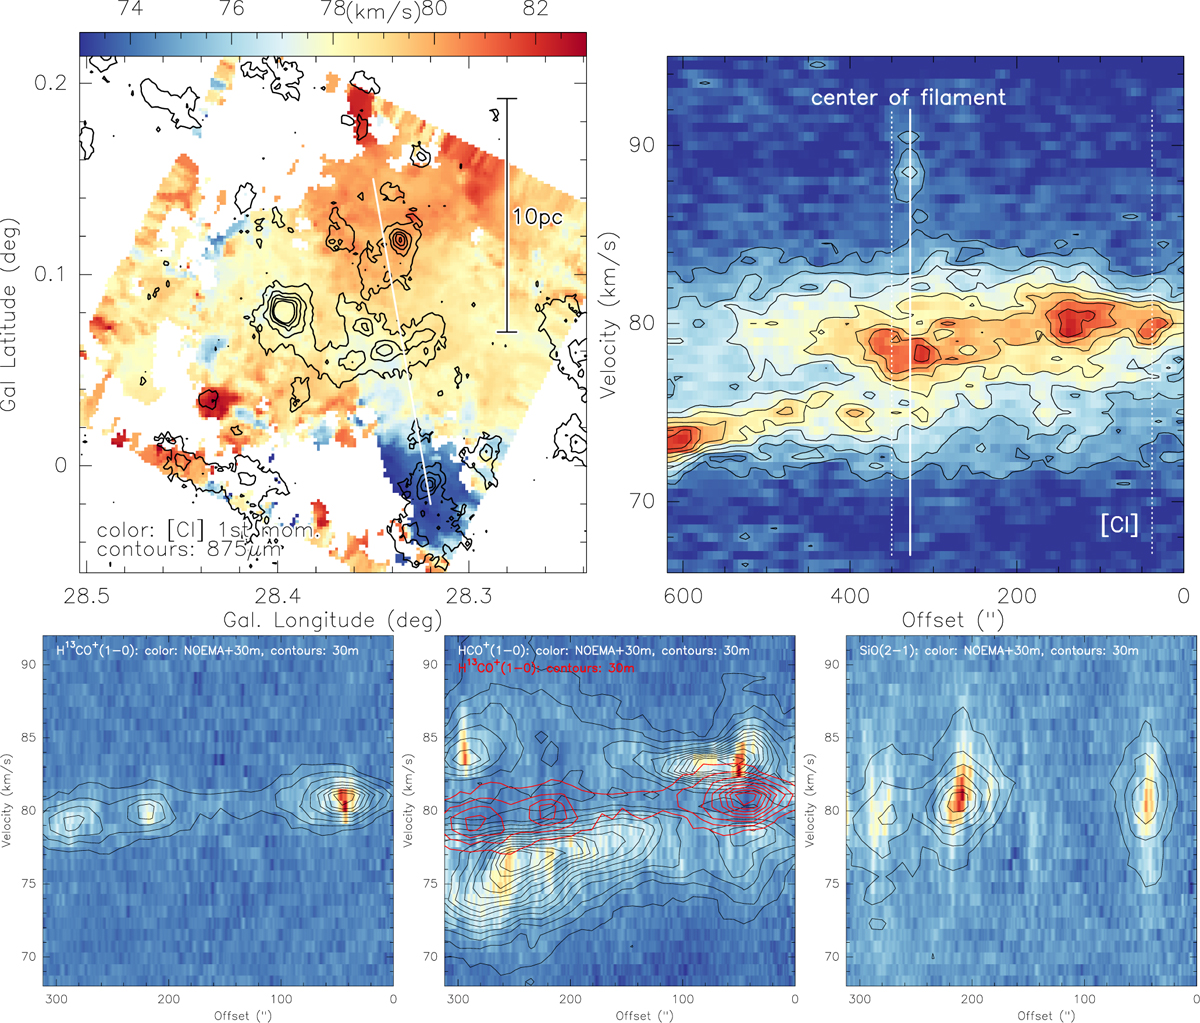
Velocity comparison between large-scale APEX [CI] and small-scale NOEMA emission data. Top two panels: reproduction of the [CI] firstmoment map and pv cut from Beuther et al. (2020). Top-left: color scale and contours showing the [CI] first-moment map and ATLASGAL 870 μm emission (contour levels starting at 4σ and continuing in 8σ steps, 1σ=50 mJy beam−1). A scale bar is shown as well. Top-right: position-velocity diagram along the white line in the top-left panel from high to low latitudes (high latitude offset 0). The full white lines mark the center position of the single-dish filament, and the dotted lines indicate the approximate extent of the corresponding pv cuts from the NOEMA data. Bottom row: three pv diagrams in color, with contours along the west–east line (offset 0 indicates west) shown in Fig. 6 in H13CO+, HCO+, and SiO. The color scale shows the corresponding NOEMA+30 m data, and the contours show the 30m data only. The red contours in the middle HCO+ panel also show the corresponding H13CO+ emission (30 m-only data). Contour levels are in 4σ steps.
Current usage metrics show cumulative count of Article Views (full-text article views including HTML views, PDF and ePub downloads, according to the available data) and Abstracts Views on Vision4Press platform.
Data correspond to usage on the plateform after 2015. The current usage metrics is available 48-96 hours after online publication and is updated daily on week days.
Initial download of the metrics may take a while.