Fig. 8
Download original image
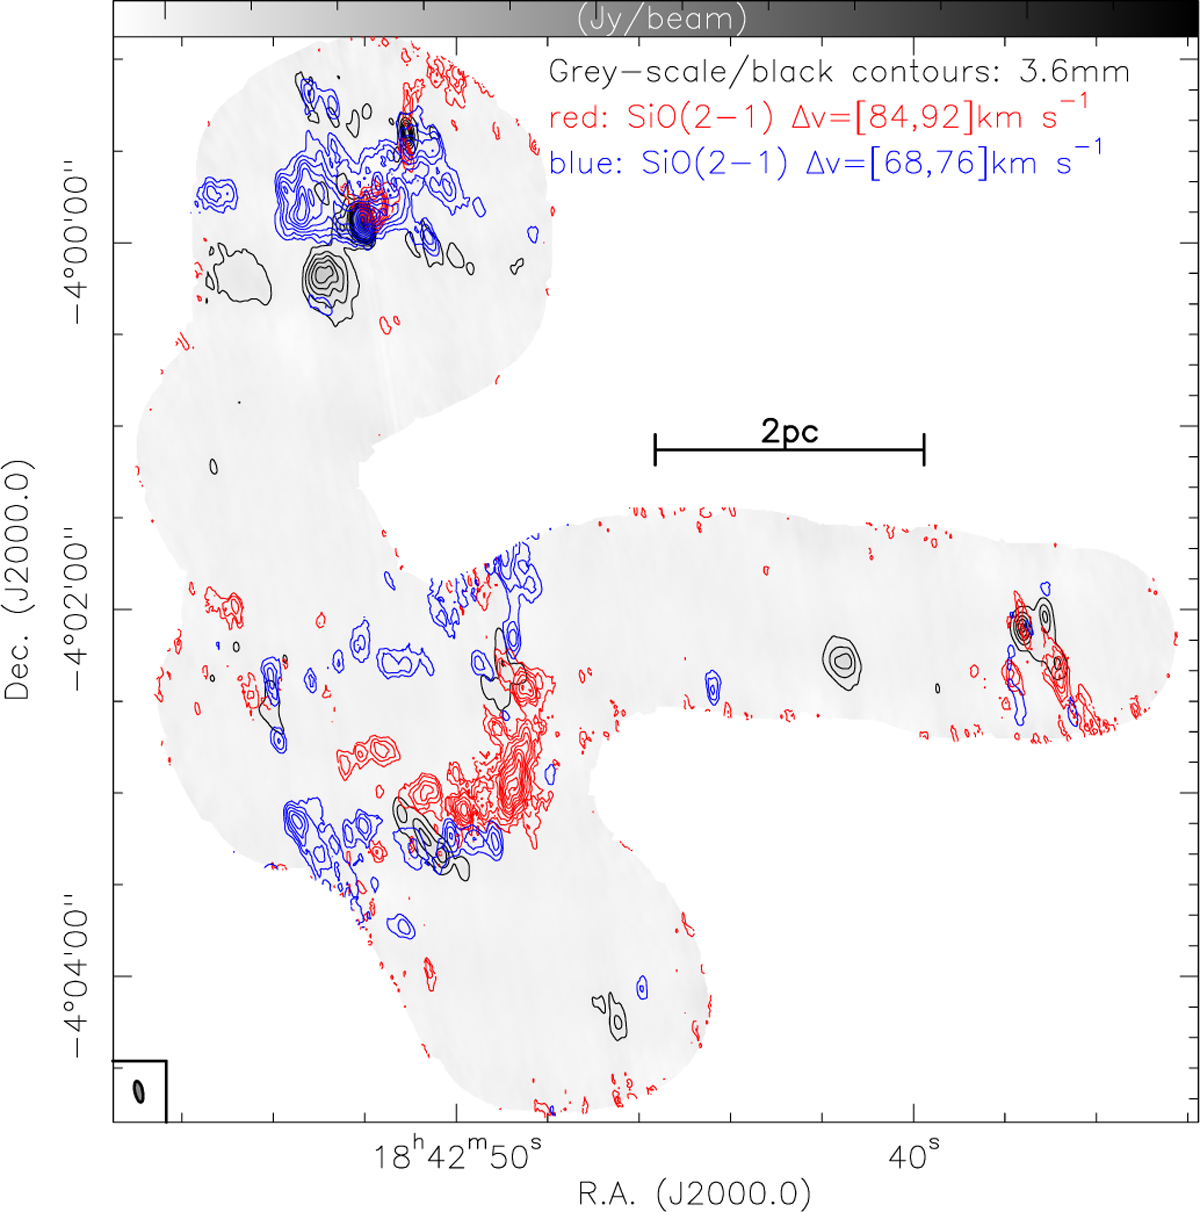
High-velocity SiO(2–1) emission. The gray scale and contours show the 3.6 mm continuum emission, as in Fig. 3. The red and blue contours show high-velocity SiO(2–1) emission with redshifted gas between 84 and 92 km s−1 and blueshifted gas between 68 and 76 km s−1, both in relative contour levels from 15 to 95% of the integrated peak emission in 10% steps. A linear scale bar and the continuum synthesized beam are shown as well.
Current usage metrics show cumulative count of Article Views (full-text article views including HTML views, PDF and ePub downloads, according to the available data) and Abstracts Views on Vision4Press platform.
Data correspond to usage on the plateform after 2015. The current usage metrics is available 48-96 hours after online publication and is updated daily on week days.
Initial download of the metrics may take a while.