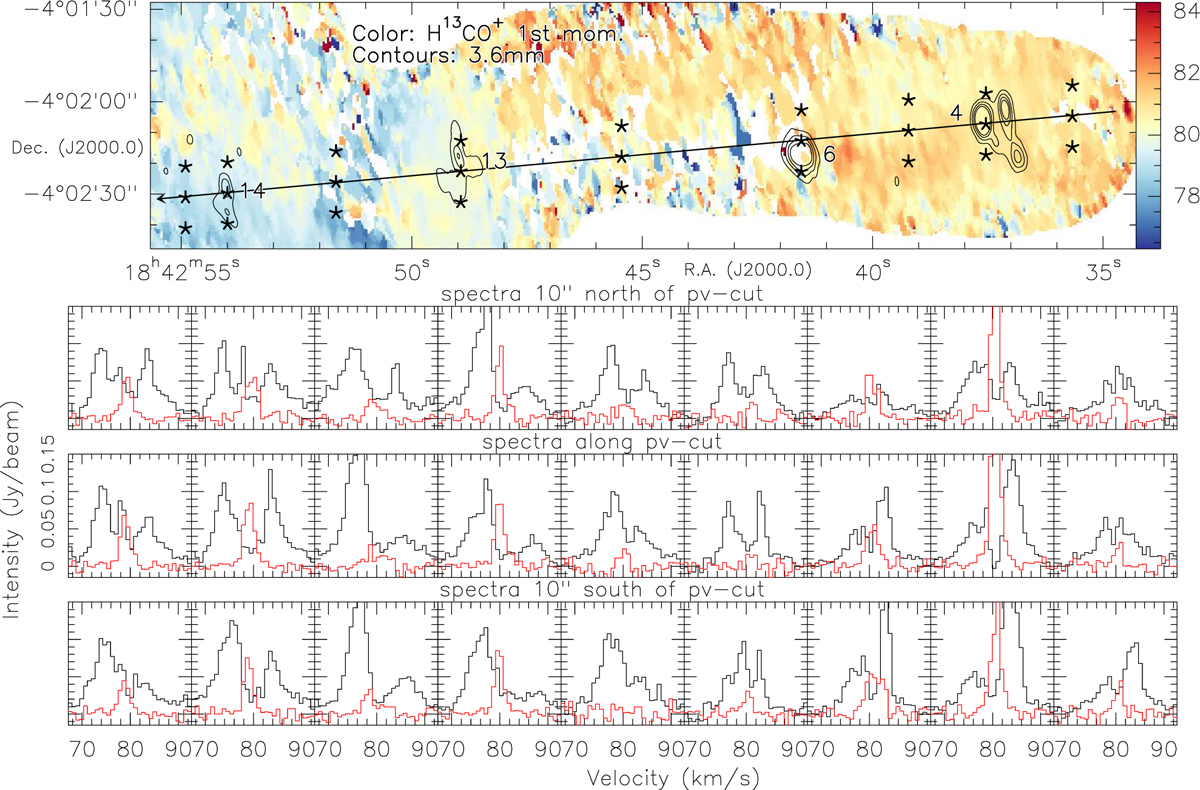
Fig. 9
Download original image
Spectra along the west–east filament. Top: finding chart with a color scale showing the H13CO+ first-moment map and contours showing the 3.6 mm continuum in 4σ steps. The arrow indicates the pv cut from Fig. 7; the stars mark the positions where the spectra are extracted; and the main sources are labeled (see Fig. 3). Bottom: corresponding HCO + and H 13 CO spectra in black and red, respectively.
Current usage metrics show cumulative count of Article Views (full-text article views including HTML views, PDF and ePub downloads, according to the available data) and Abstracts Views on Vision4Press platform.
Data correspond to usage on the plateform after 2015. The current usage metrics is available 48-96 hours after online publication and is updated daily on week days.
Initial download of the metrics may take a while.