Fig. 1.
Download original image
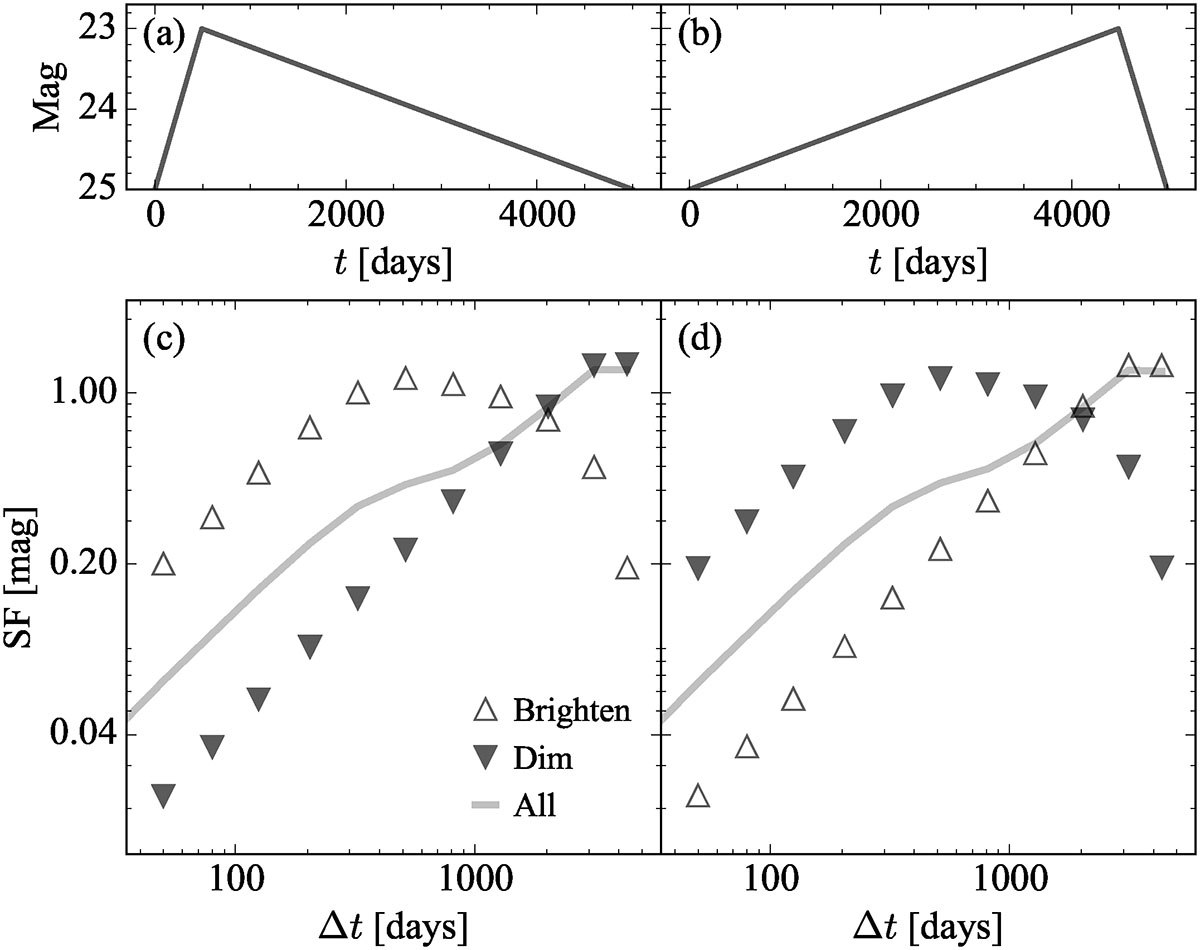
Conceptual illustration of structure function (SF) asymmetry. Panel (a): Example light curve with a fast rise and slow decay. Panel (b): Opposite case with a slow rise and fast decay. The corresponding SFs are decomposed into the total (solid line), brightening (SF+; up triangle), and fading (SF−; down triangle) components in panels (c) and (d).
Current usage metrics show cumulative count of Article Views (full-text article views including HTML views, PDF and ePub downloads, according to the available data) and Abstracts Views on Vision4Press platform.
Data correspond to usage on the plateform after 2015. The current usage metrics is available 48-96 hours after online publication and is updated daily on week days.
Initial download of the metrics may take a while.