Open Access
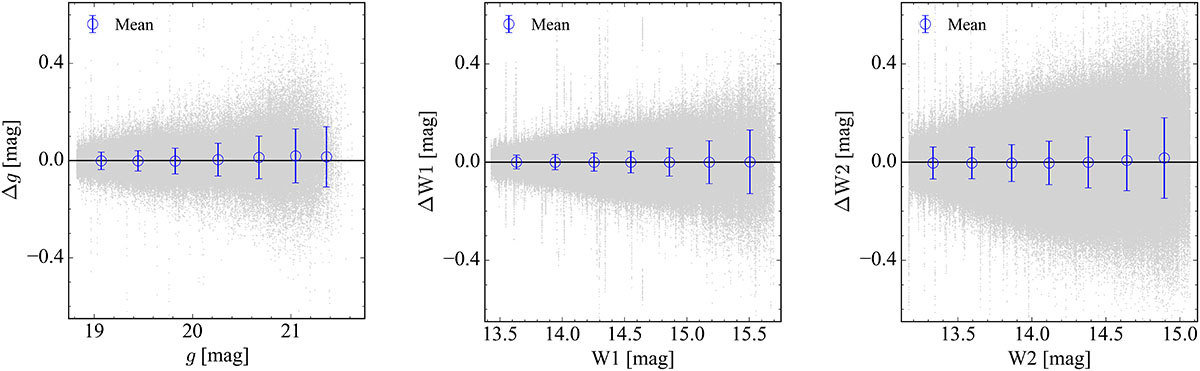
Fig. 2.
Download original image
Differences between magnitude pairs for inactive galaxies in the g (left), W1 (middle), and W2 (right) bands. Gray points represent individual magnitude differences. Open blue circles denote the mean values of the magnitude differences with 1σ error bars.
Current usage metrics show cumulative count of Article Views (full-text article views including HTML views, PDF and ePub downloads, according to the available data) and Abstracts Views on Vision4Press platform.
Data correspond to usage on the plateform after 2015. The current usage metrics is available 48-96 hours after online publication and is updated daily on week days.
Initial download of the metrics may take a while.