Fig. 8.
Download original image
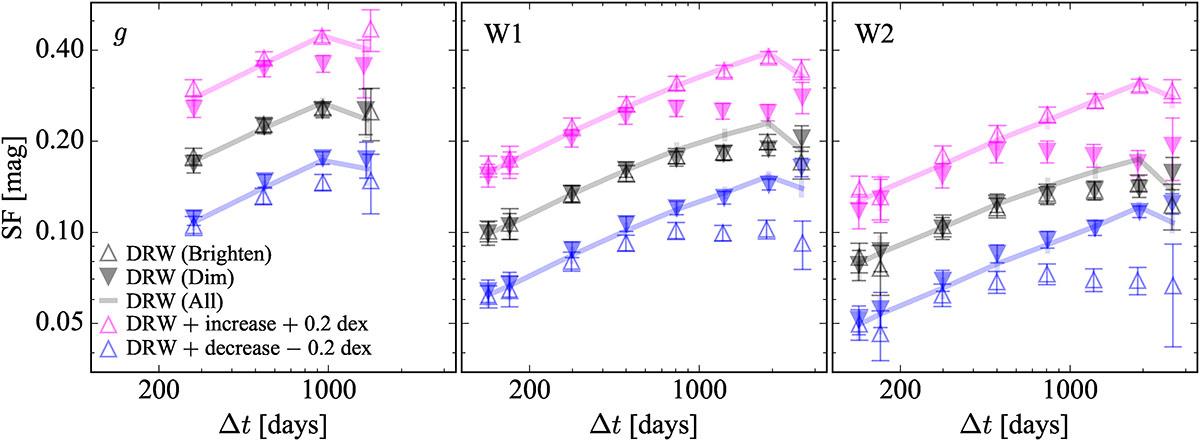
Ensemble SFs computed from 200 mock light curves for the g (left), W1 (middle), and W2 (right) bands. Upward and downward triangles denote the ensemble SFs for the brightening and dimming phases, respectively, and the solid line denotes the ensemble SFs for all phases. Black triangles represent the ensemble SFs following a DRW model, while magenta and blue triangles represent those with global increasing and decreasing trends in brightness, respectively. The SF value was shifted arbitrarily to improve the clarity of the visualization.
Current usage metrics show cumulative count of Article Views (full-text article views including HTML views, PDF and ePub downloads, according to the available data) and Abstracts Views on Vision4Press platform.
Data correspond to usage on the plateform after 2015. The current usage metrics is available 48-96 hours after online publication and is updated daily on week days.
Initial download of the metrics may take a while.