Fig. 2.
Download original image
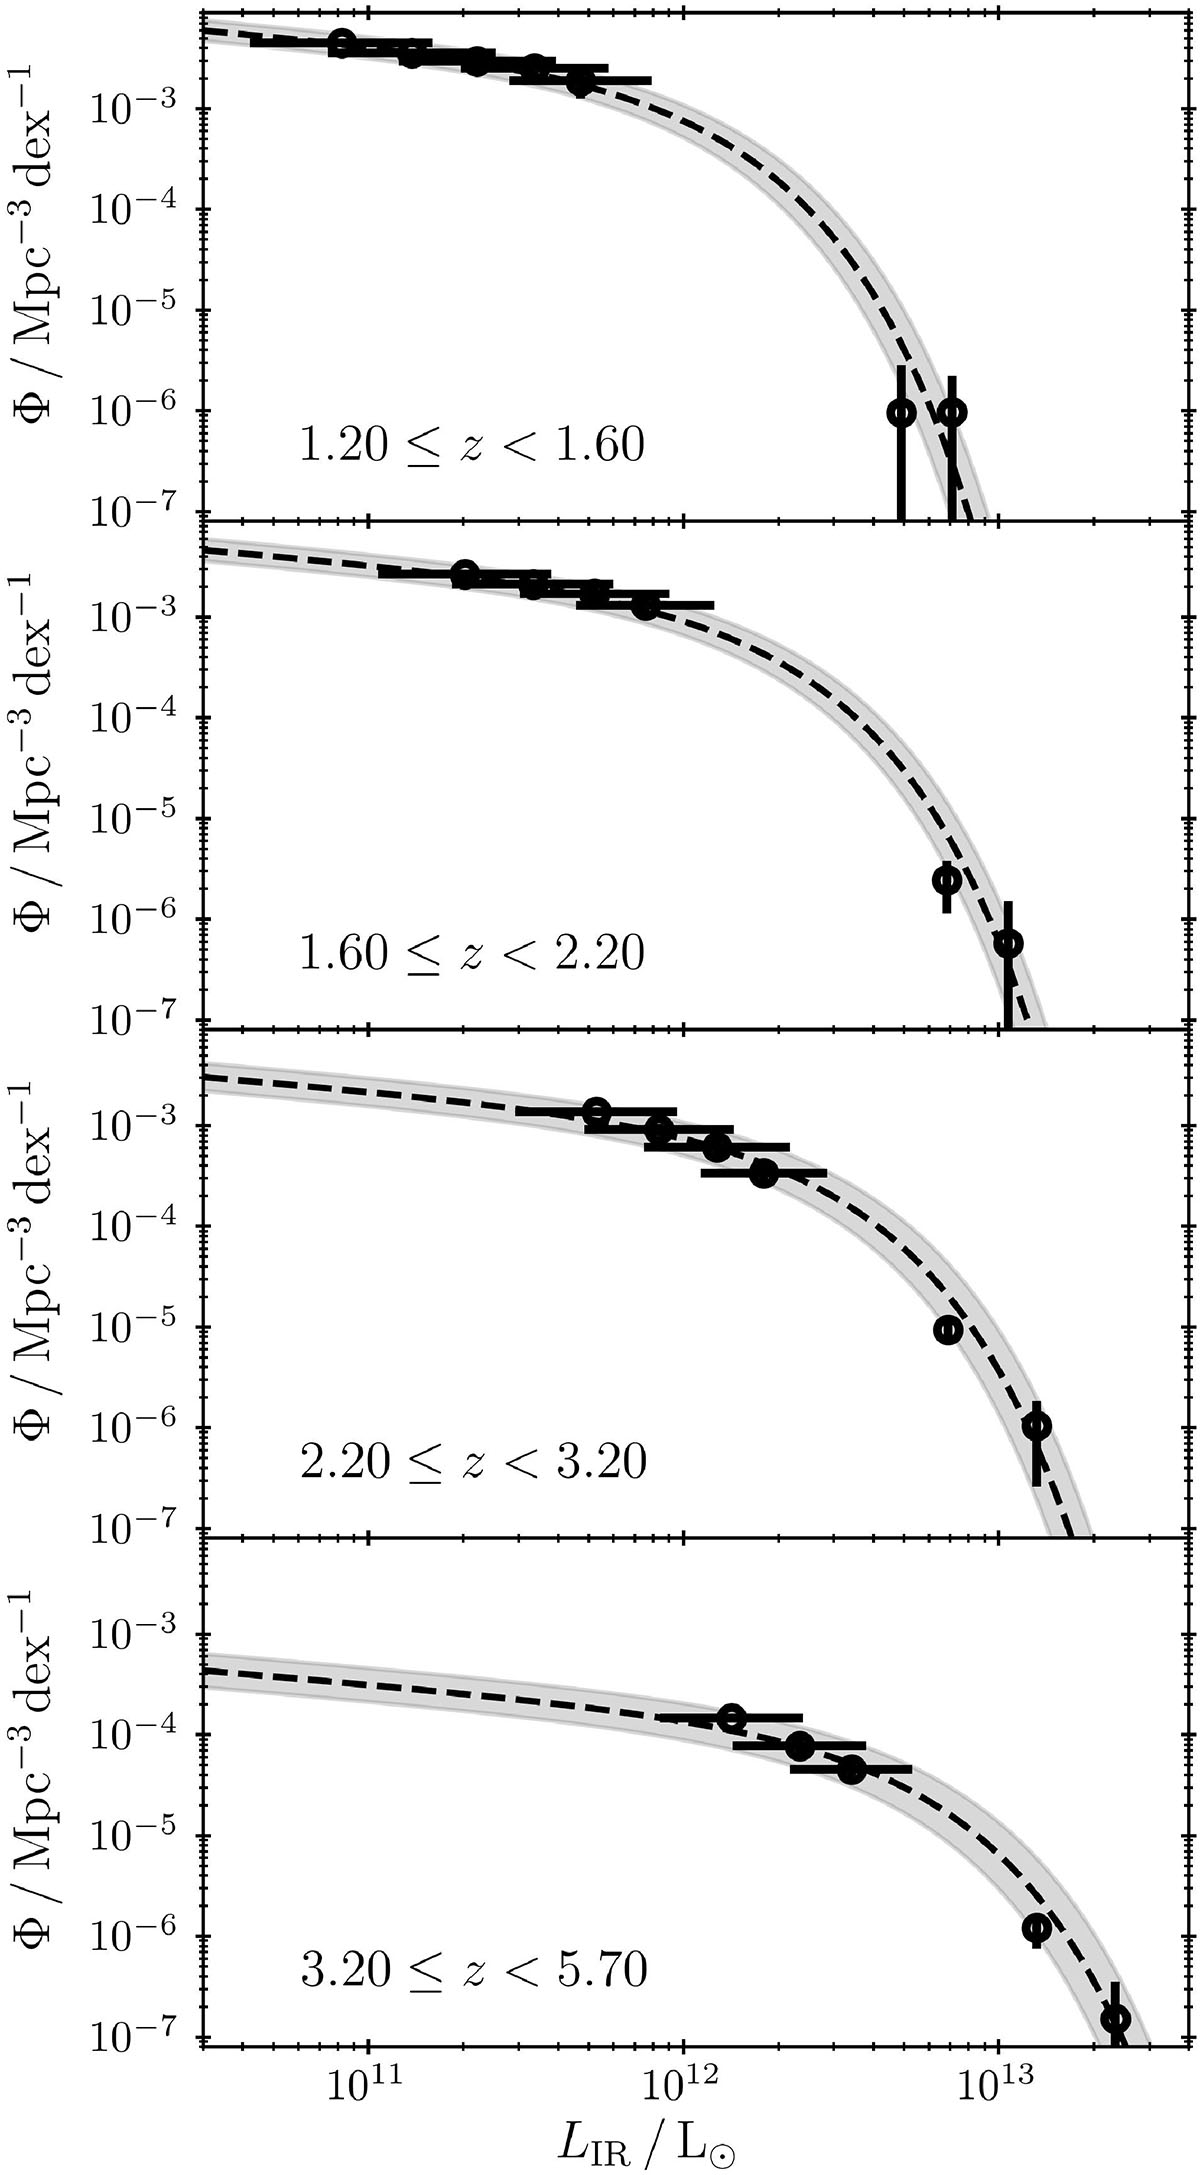
Infrared luminosity function found in this work at different redshift bins, as indicated in the plot. The faint-end data (Table 1), determined through stacking (see Section 3.1.1 for details), are depicted by black points with horizontal error bars. The remaining bright-end data (Table 3) found using the ALMA follow-up data of the S2CLS UKIDSS UDS sources (AS2UDS; Stach et al. 2019) are also shown (Section 3.1.2). The best-fit Schechter functions of Equation (6) are represented by dashed black lines, with the gray area representing 1σ uncertainties. The faint-end slope was determined at two low redshift bins, and the more accurate result, α = −0.26 ± 0.11, was adopted at all the remaining redshifts, as explained in Section 3.1.3.
Current usage metrics show cumulative count of Article Views (full-text article views including HTML views, PDF and ePub downloads, according to the available data) and Abstracts Views on Vision4Press platform.
Data correspond to usage on the plateform after 2015. The current usage metrics is available 48-96 hours after online publication and is updated daily on week days.
Initial download of the metrics may take a while.