Fig. 7.
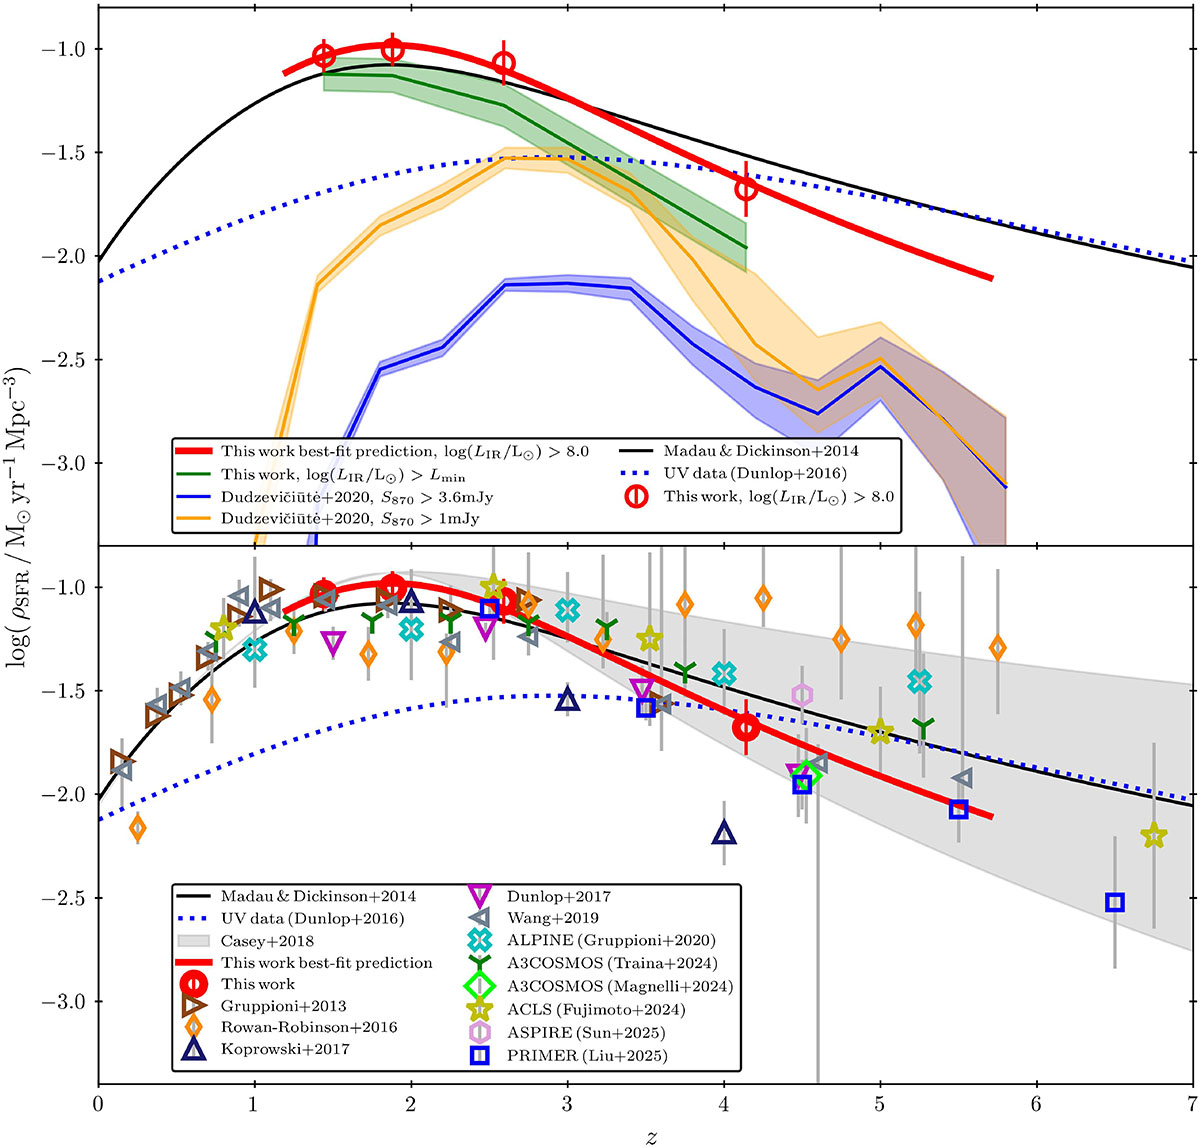
Download original image
Star formation rate density for four redshift bins studied in this work (Table 5), depicted with red circles with error bars, found by integrating the corresponding IR LFs between 8.0 < LIR/L⊙ < 14.0. The solid red line represents the redshift evolution of the star formation rate density derived from the best fits to the Schechter function parameters of Figure 3 between redshifts considered in this work (1.2 < z < 5.7). The solid black line represents the IR ρSFR evolution found in Madau & Dickinson (2014), while the dotted blue line shows the evolution of the UV ρSFR of Dunlop (2016). Top: Comparison of our results with those presented in Dudzevičiūtė et al. (2020), where the blue and orange lines depict the contribution to ρSFR from 870 μm sources with fluxes above 3.6 mJy and 1.0 mJy (extrapolated using ALMA number counts of Hatsukade et al. 2018), respectively. The shaded areas represent 1σ errors. The green line shows the evolution down to the IR luminosity detection limits of our IR faint sample presented in Section 3.1.1. The differences in the derived values of the ρSFR at a specific redshift across the samples arise from the different LIR limits adopted (see Section 3.2). At z ≳ 4, these differences decrease, which can be attributed to the growing contribution of bright submillimeter galaxies to the ρSFR. Bottom: Comparison of ρSFR found in this work with the most recent results from the literature plotted with color symbols (Gruppioni et al. 2013; Rowan-Robinson et al. 2016; Koprowski et al. 2017; Dunlop et al. 2017; Wang et al. 2019; Gruppioni et al. 2020; Traina et al. 2024; Magnelli et al. 2024; Fujimoto et al. 2024; Sun et al. 2025; Liu et al. 2026). The shaded region shows the results of Casey et al. (2018) bounded at the bottom by the dust-poor models and at the top by the dust-rich models of the early Universe. It can be seen that our results are in a good agreement with the results of Dunlop et al. (2017), Wang et al. (2019), Magnelli et al. (2024), and Liu et al. (2026). Also, some inconsistencies with other works are apparent, the discussion of which is presented in Section 3.2. Considering the shaded region of Casey et al. (2018), it can be seen that the results of this work point toward the dust-poor early Universe scenario, where the IR sources are expected to dominate the total ρSFR out to z ∼ 4.
Current usage metrics show cumulative count of Article Views (full-text article views including HTML views, PDF and ePub downloads, according to the available data) and Abstracts Views on Vision4Press platform.
Data correspond to usage on the plateform after 2015. The current usage metrics is available 48-96 hours after online publication and is updated daily on week days.
Initial download of the metrics may take a while.