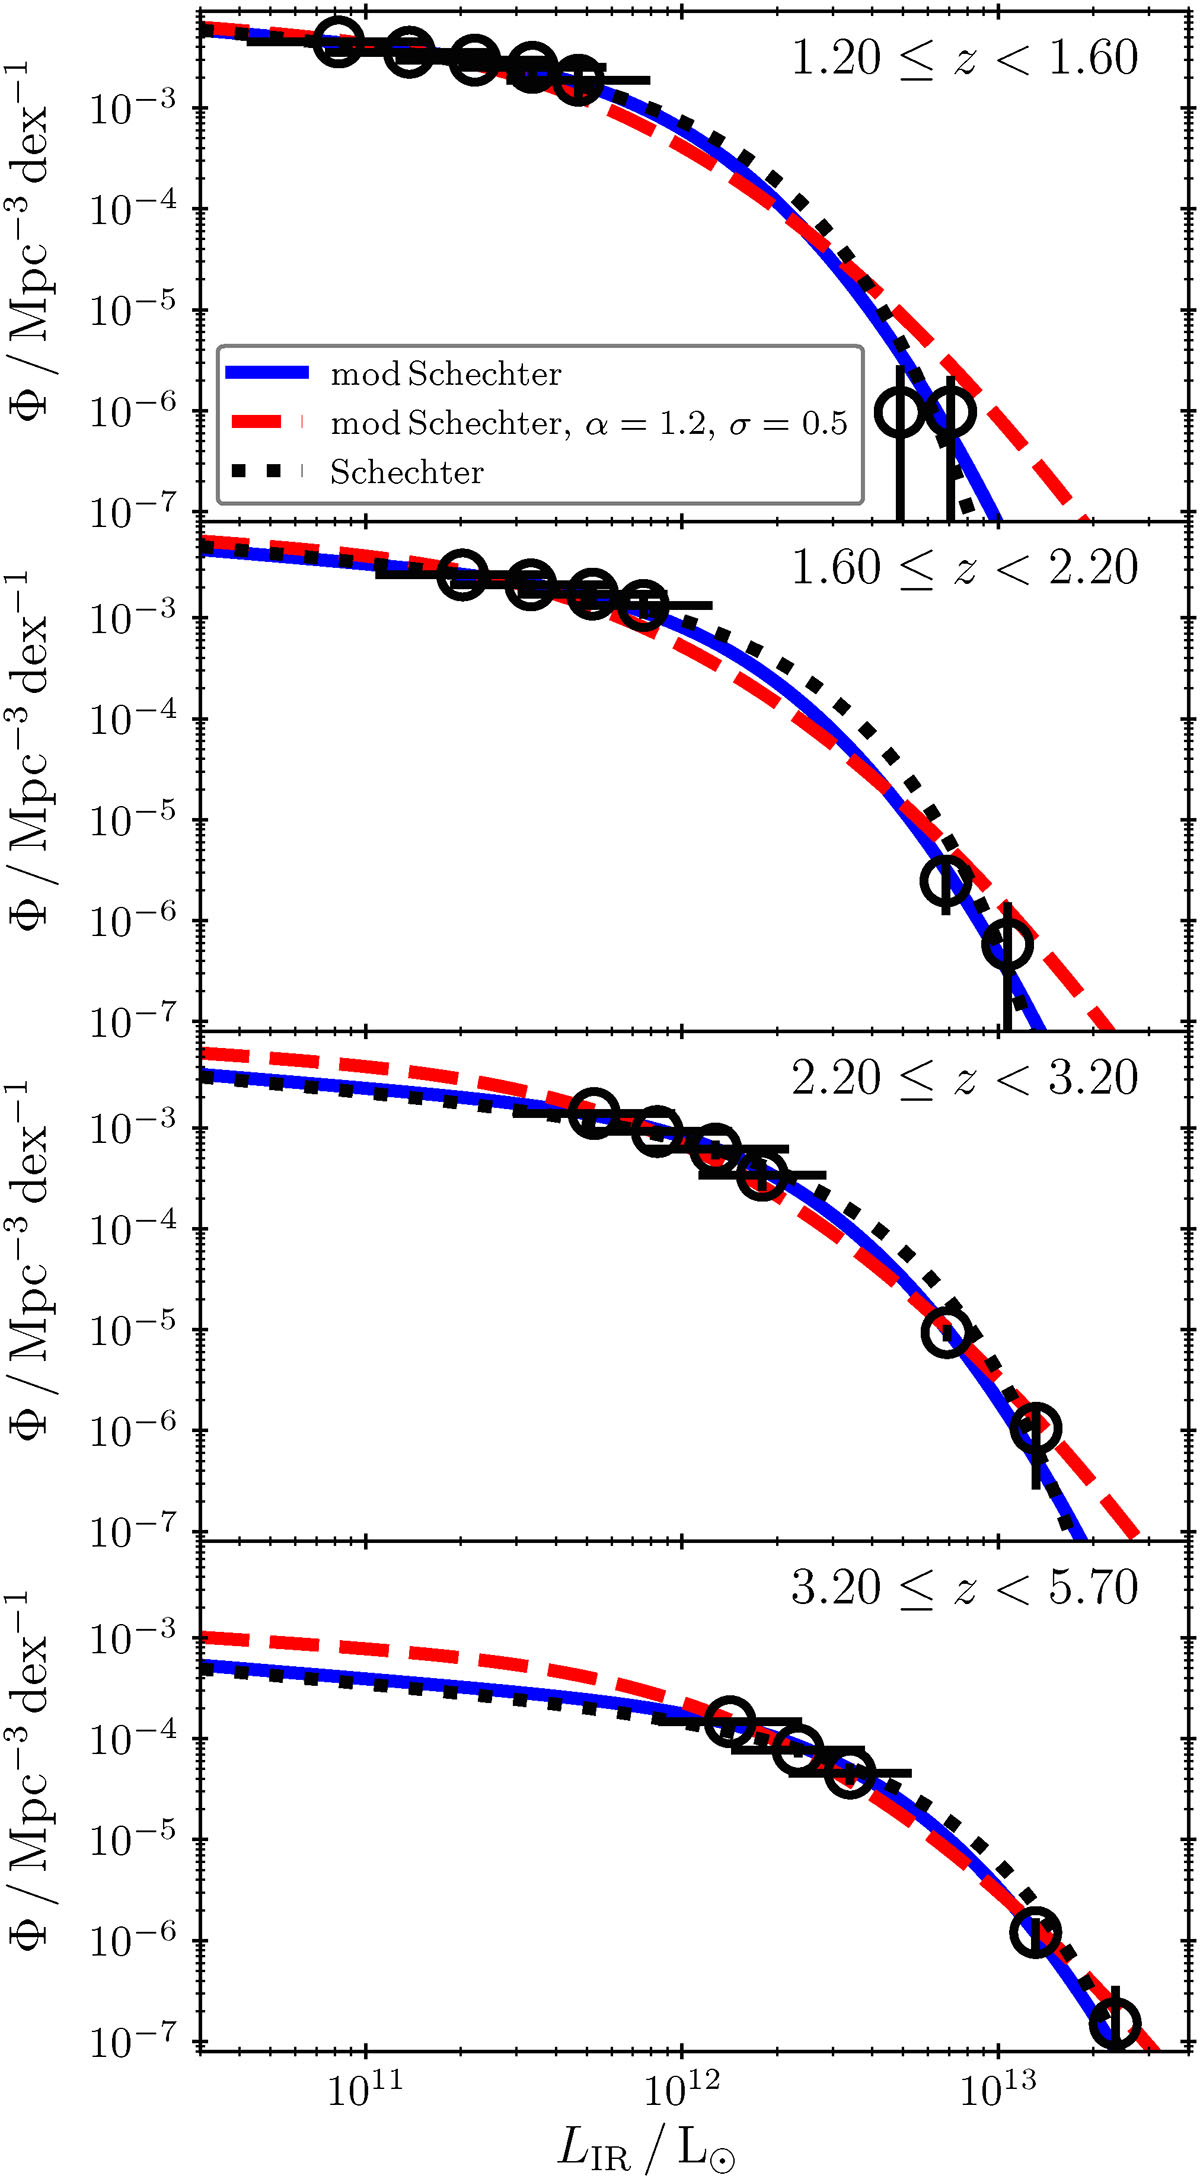
Fig. A.1.
Download original image
Infrared LF binned data of Figure 2 (black circles with error bars) with the best-fit functional forms overlayed. The modified Schechter fits with α and σ parameters (Equation A.1) allowed to vary freely are depicted with blue solid line. Fixing α and σ at the recent literature values of -0.2 and 0.5, respectively (Gruppioni et al. 2013; Wang et al. 2019; Gruppioni et al. 2020; Traina et al. 2024), produces the modified Schechter function presented with the red dashed line, while the best-fit classical Schechter curve (Equation 6) derived in this work is shown with the black dotted line.
Current usage metrics show cumulative count of Article Views (full-text article views including HTML views, PDF and ePub downloads, according to the available data) and Abstracts Views on Vision4Press platform.
Data correspond to usage on the plateform after 2015. The current usage metrics is available 48-96 hours after online publication and is updated daily on week days.
Initial download of the metrics may take a while.