Fig. 2.
Download original image
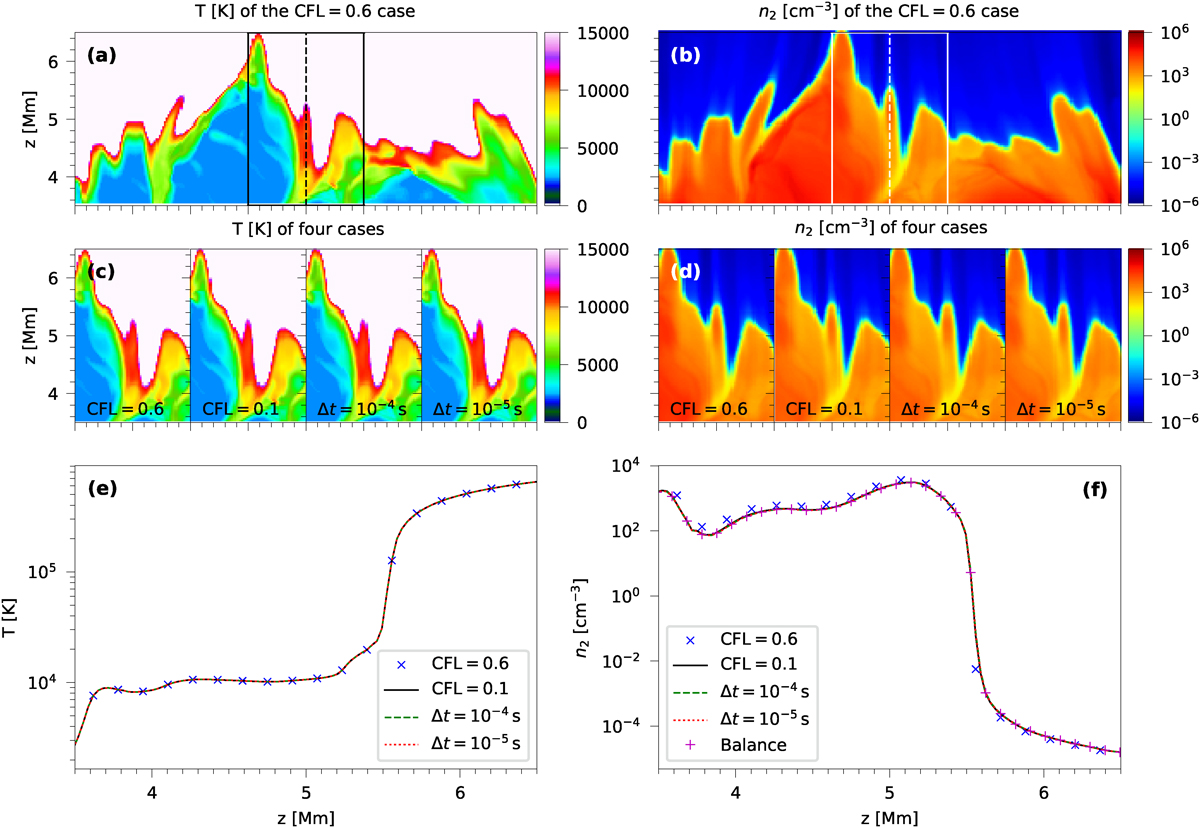
Temperature and n2 population distributions at t = 60 s for the four simulation cases. The average time steps of the CFL = 0.6 and CFL = 0.1 cases are approximately 10−2 s and 2 × 10⁻³ s, respectively. Panels (a) and (b) display the temperature and n2 distributions for the case with CFL = 0.6. Panels (c) and (d) show the corresponding regions (outlined in panels (a) and (b)) for all four cases, respectively. Panels (e) and (f) present 1D profiles of temperature and n2, respectively, extracted along the dashed lines in panels (a) and (b), for all four cases. In panel (f), an additional n2 profile computed from the balance solution for the Δt = 10−5 s case is also shown for reference.
Current usage metrics show cumulative count of Article Views (full-text article views including HTML views, PDF and ePub downloads, according to the available data) and Abstracts Views on Vision4Press platform.
Data correspond to usage on the plateform after 2015. The current usage metrics is available 48-96 hours after online publication and is updated daily on week days.
Initial download of the metrics may take a while.