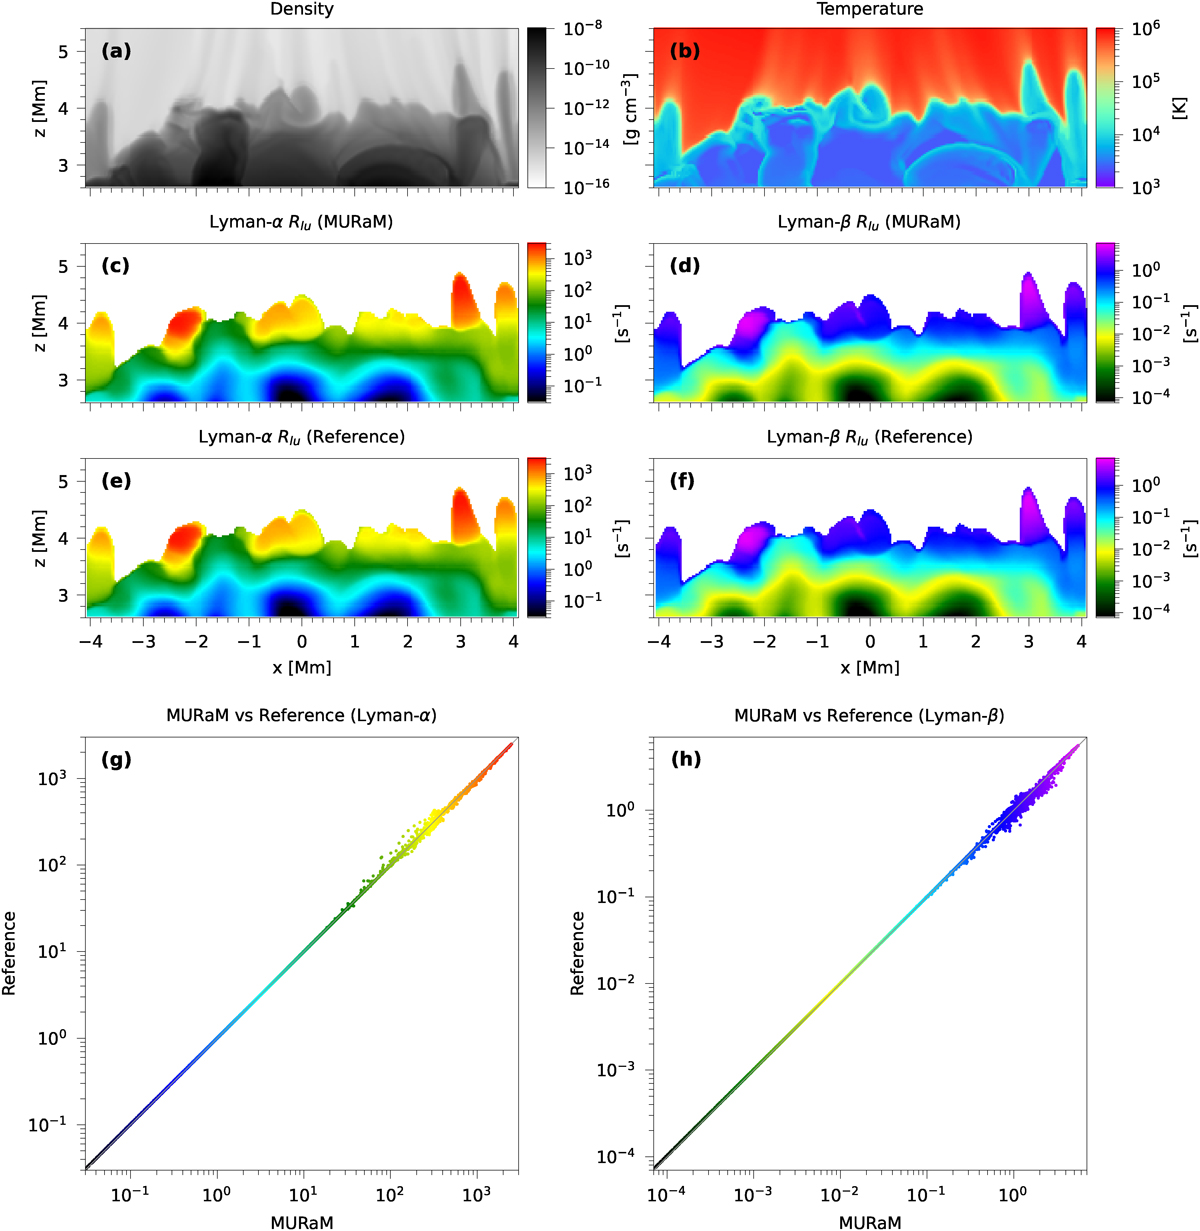
Fig. 3.
Download original image
Comparison of the upward radiative rate coefficients obtained by MURaM (using the single-frequency approach) and reference (using the multifrequency approach by Lightweaver). Panels (a) and (b) show the atmospheric density and temperature distributions, respectively. Panels (c) and (d) display the Lyman-α and Lyman-β rate coefficients in the cool region (T < = 0.2 MK) computed by MURaM, while panels (e) and (f) present the corresponding coefficients from the reference. Panels (g) and (h) display the results of the point-to-point amplitude comparison, with the horizontal axis representing the values from MURaM and the vertical axis corresponding to the amplitudes from the reference. The points are colored according to their corresponding color in the MURaM result panels (c, d), so the area where the points are located can be inferred from the color. Since the highly ionized corona is not the region of interest for NLTE RT, the rate coefficients at high temperatures (T > 0.2 MK) were manually set to zero to emphasize the comparison results in the lower atmosphere. The time corresponding to the simulated data is t = 1 s.
Current usage metrics show cumulative count of Article Views (full-text article views including HTML views, PDF and ePub downloads, according to the available data) and Abstracts Views on Vision4Press platform.
Data correspond to usage on the plateform after 2015. The current usage metrics is available 48-96 hours after online publication and is updated daily on week days.
Initial download of the metrics may take a while.