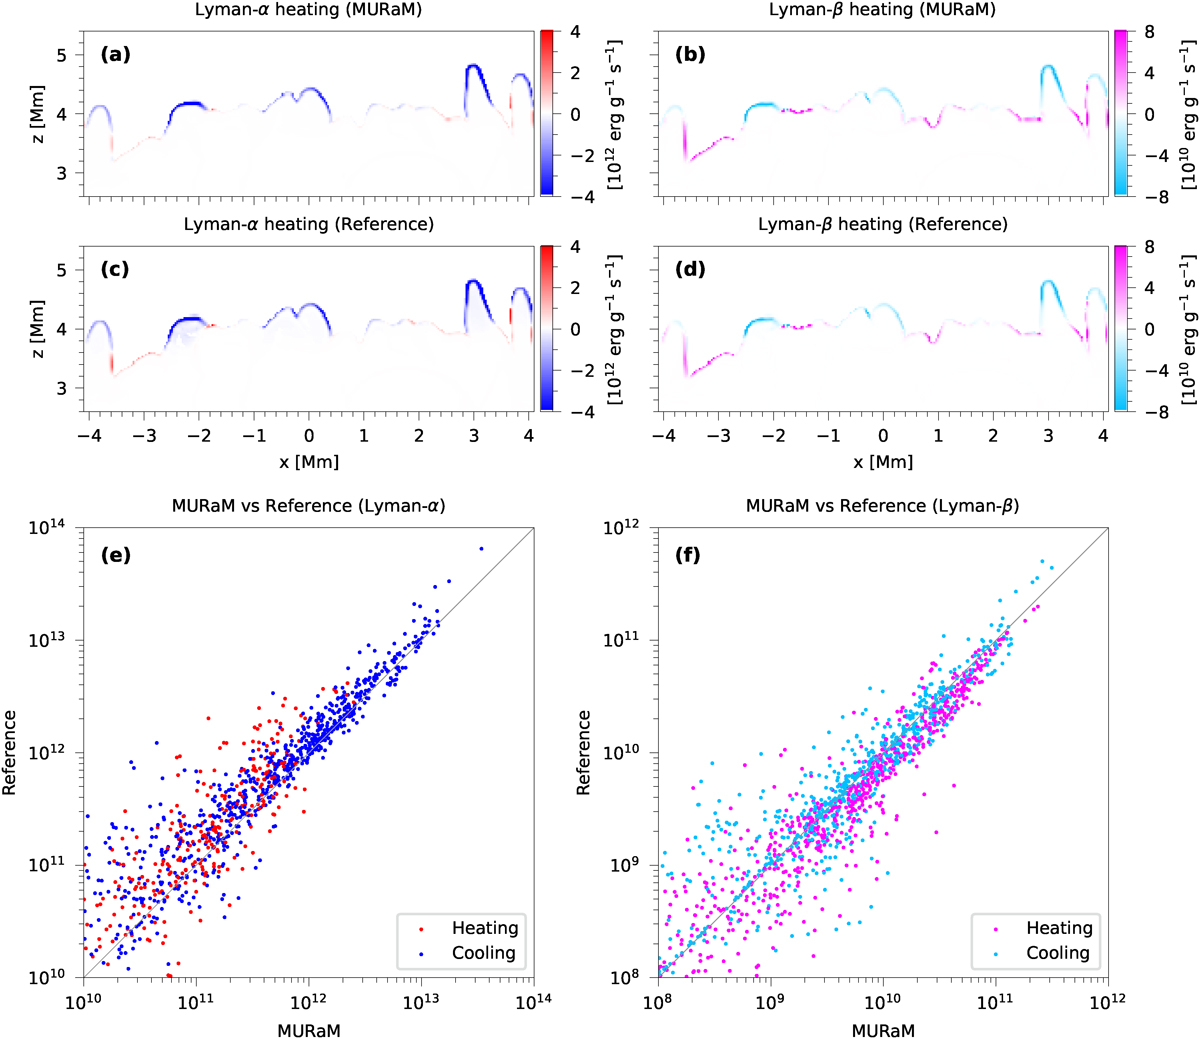
Fig. 4.
Download original image
Comparison of the upward radiative rate coefficients obtained by MURaM and Lightweaver (reference). Panels (a) and (b) show the heating effects contributed by the Lyman-α and Lyman-β lines from MURaM, while panels (c) and (d) present the corresponding heating effects in the reference. Panels (e) and (f) give the point-to-point amplitude comparison, where the horizontal axis corresponds to the values obtained from MURaM and the vertical axis to the amplitudes from the reference. The points are colored based on their sign in both the MURaM and reference results, with red and pink indicating heating, and blue and cyan indicating cooling. The time corresponding to the simulated data is t = 1 s.
Current usage metrics show cumulative count of Article Views (full-text article views including HTML views, PDF and ePub downloads, according to the available data) and Abstracts Views on Vision4Press platform.
Data correspond to usage on the plateform after 2015. The current usage metrics is available 48-96 hours after online publication and is updated daily on week days.
Initial download of the metrics may take a while.