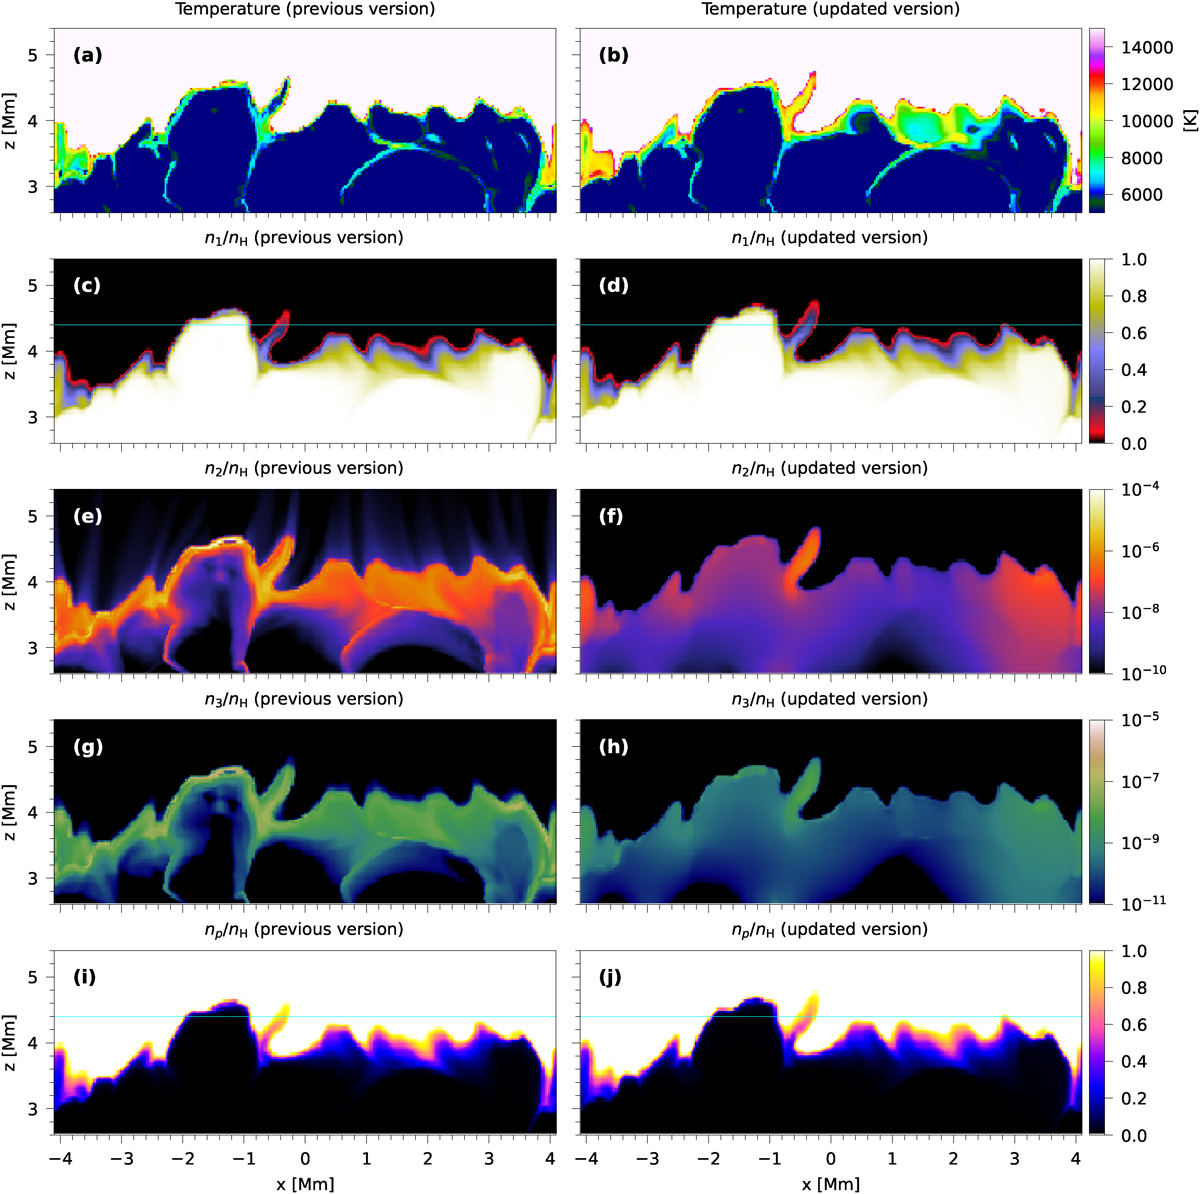
Fig. 5.
Download original image
Comparison of the temperature and population distributions obtained by two versions of the MURaM code. The left column shows results from the previous version, while the right column presents results from the updated version. The first row displays the temperature distribution, while the second, third, fourth, and fifth rows show the population fractions of level 1, level 2, level 3, and protons, respectively, where np is the proton number density and nH is the total hydrogen number density. To compare the extended height of the incompletely ionized region, a reference line is provided in panels (c), (d), (i) and (j). The previous version assumes Rlu = Rul = 0 for the Lyman series and computes radiative cooling using an empirical recipe, whereas the updated version calculates the Lyman-α and β lines rate coefficients and the associated radiative heating and cooling through solving the RT equation. The time corresponding to the simulated data is t = 20 s
Current usage metrics show cumulative count of Article Views (full-text article views including HTML views, PDF and ePub downloads, according to the available data) and Abstracts Views on Vision4Press platform.
Data correspond to usage on the plateform after 2015. The current usage metrics is available 48-96 hours after online publication and is updated daily on week days.
Initial download of the metrics may take a while.