Fig. 6.
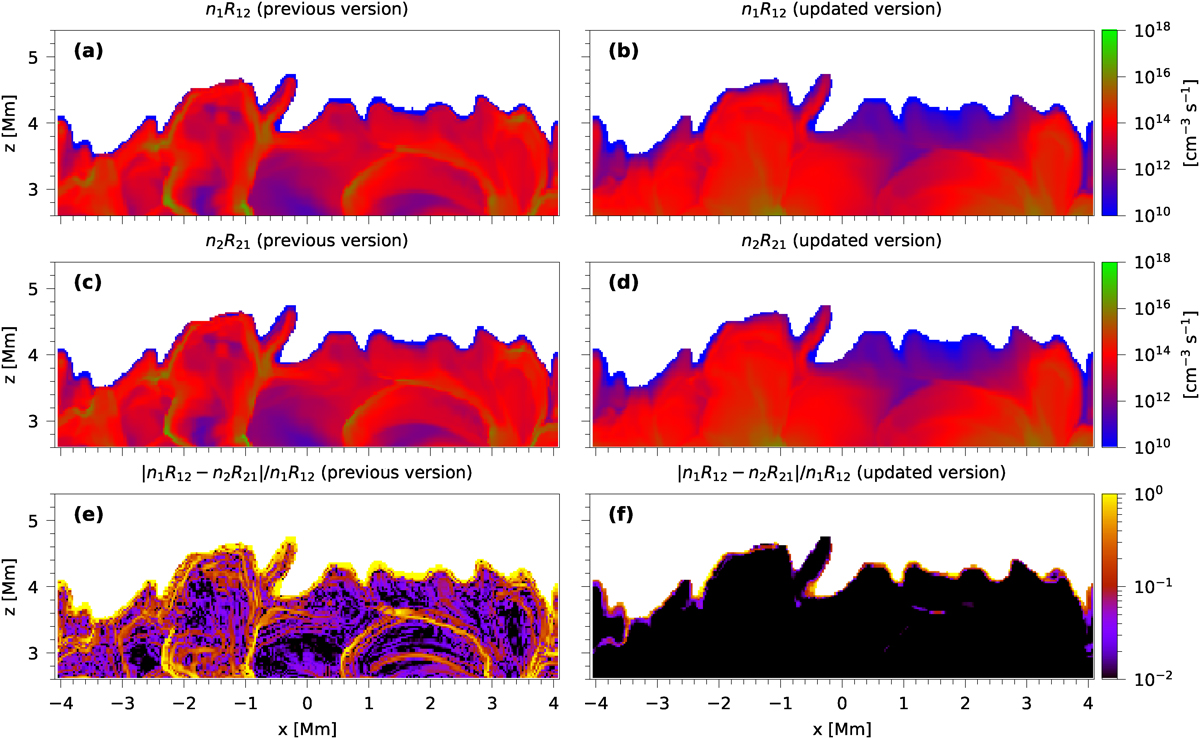
Download original image
Comparison of the degree to which the population distributions provided by the two versions of the MURaM code conform to the radiative balance. Radiative upward and downward transition rates are computed from the populations shown in Fig. 5 using the Lightweaver code and are illustrated in panels (a)-(d). Panels (e) and (f) show the degree of deviation from the detailed radiative balance condition in the results from the two versions, with the calculation formula provided in the title. The time corresponding to the simulated data is t = 20 s. The rate coefficients at high temperatures (T > 0.2 MK) were manually set to zero to emphasize the results in the lower atmosphere.
Current usage metrics show cumulative count of Article Views (full-text article views including HTML views, PDF and ePub downloads, according to the available data) and Abstracts Views on Vision4Press platform.
Data correspond to usage on the plateform after 2015. The current usage metrics is available 48-96 hours after online publication and is updated daily on week days.
Initial download of the metrics may take a while.