Fig. 7.
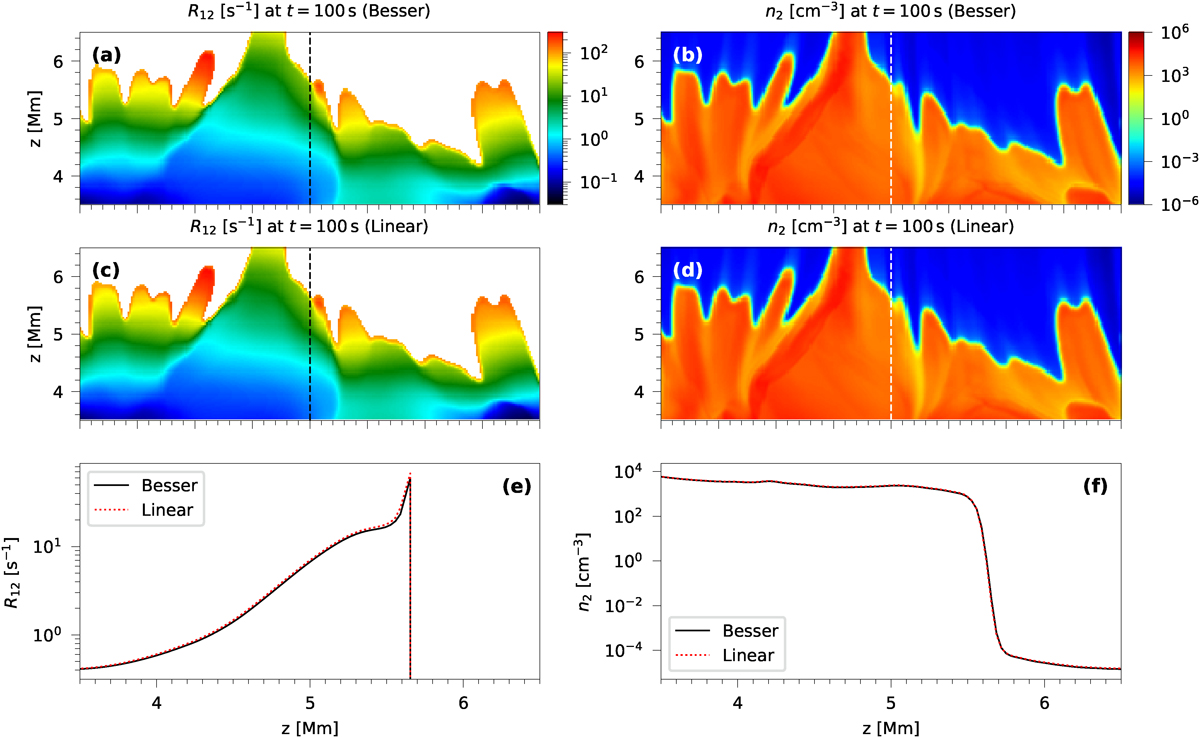
Download original image
Comparison of the simulation results generated by two solvers. The radiative rate-coefficient distributions (R12) produced by the BESSER and linear solvers are shown in panels (a) and (c), respectively, while panel (e) compares the distributions extracted along the dashed line depicted in panels (a) and (c). Similarly, the level-population distributions (n2) obtained from the two solvers are presented in panels (b) and (d), respectively, with panel (f) showing the corresponding comparison along the dashed line. All results correspond to t = 100 s. The rate coefficients at high temperatures (T > 0.2 MK) were manually set to zero to emphasize the results in the lower atmosphere.
Current usage metrics show cumulative count of Article Views (full-text article views including HTML views, PDF and ePub downloads, according to the available data) and Abstracts Views on Vision4Press platform.
Data correspond to usage on the plateform after 2015. The current usage metrics is available 48-96 hours after online publication and is updated daily on week days.
Initial download of the metrics may take a while.