Fig. 3.
Download original image
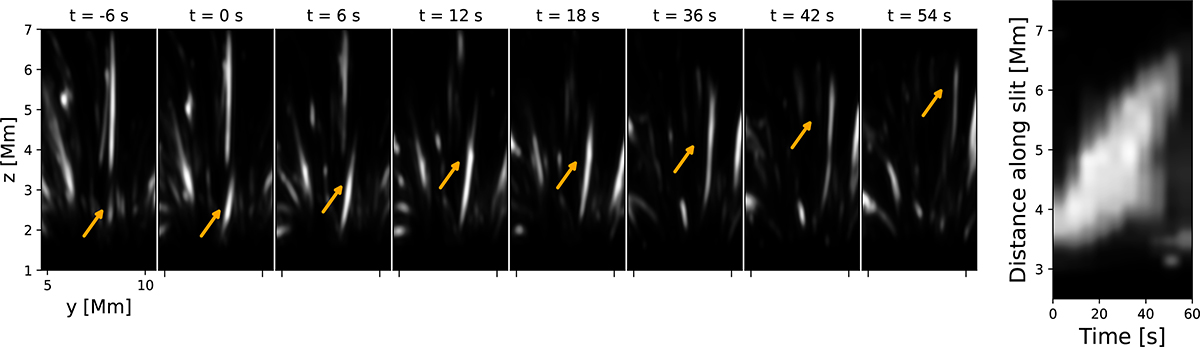
Evolution of a feature (after degradation to the resolution of Hinode/SOT) resembling a type-II spicule with a maximum apparent velocity of 66 km/s. The panels starting on the left show the evolution of our feature of interest. The orange arrows point to this feature. The time-distance plot for this feature is shown on the right. The slit for the time-distance plot is placed along the axis of the feature during its evolution. The time t = 0 s marks the first prominent appearance of the feature.
Current usage metrics show cumulative count of Article Views (full-text article views including HTML views, PDF and ePub downloads, according to the available data) and Abstracts Views on Vision4Press platform.
Data correspond to usage on the plateform after 2015. The current usage metrics is available 48-96 hours after online publication and is updated daily on week days.
Initial download of the metrics may take a while.