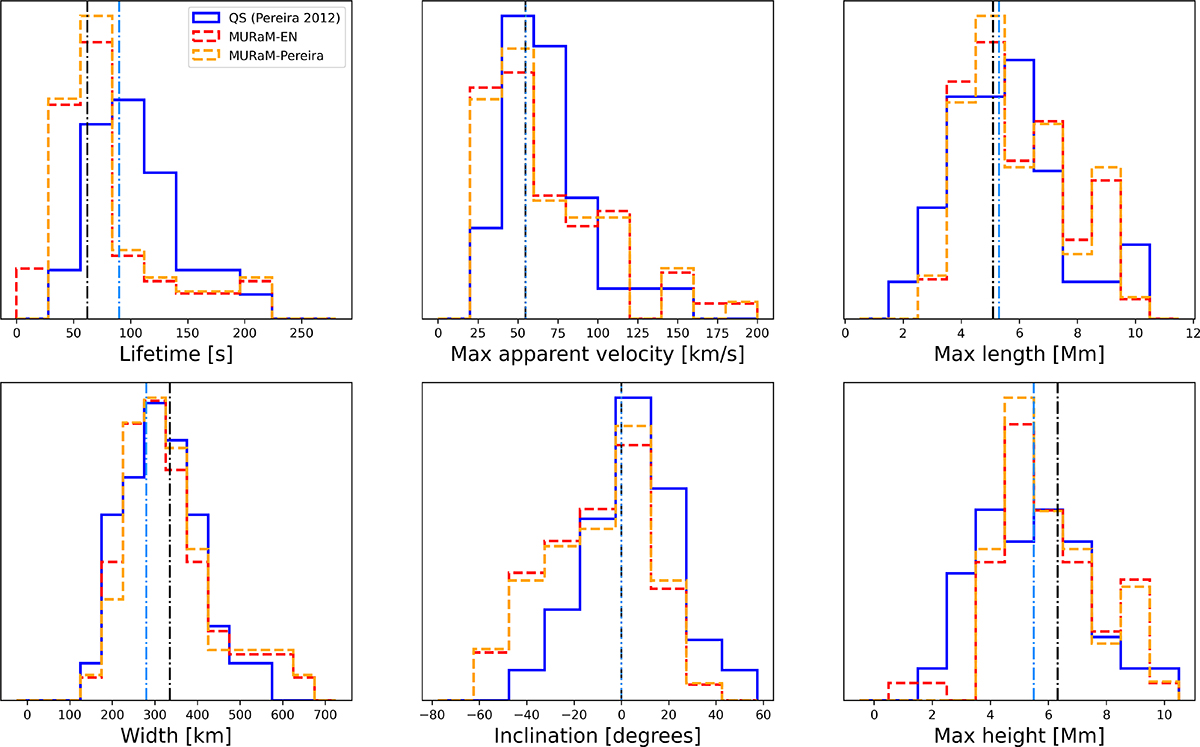
Fig. 6.
Download original image
Statistical properties of 58 spicules in the MURaM enhanced network simulation, excluding short-lived spicules (MURaM-Pereira; see text for details) compared with 174 spicules in quiet Sun (QS) observations with the Hinode/SOT. We also show the original distribution (MURaM-EN) without excluding short-lived spicules in red. All the distributions are normalised. The dot-dashed blue lines indicates the median value for the QS observations, while the dot-dashed black lines indicate the median value for the simulations given the lifetime criteria (MURaM-Pereira).
Current usage metrics show cumulative count of Article Views (full-text article views including HTML views, PDF and ePub downloads, according to the available data) and Abstracts Views on Vision4Press platform.
Data correspond to usage on the plateform after 2015. The current usage metrics is available 48-96 hours after online publication and is updated daily on week days.
Initial download of the metrics may take a while.