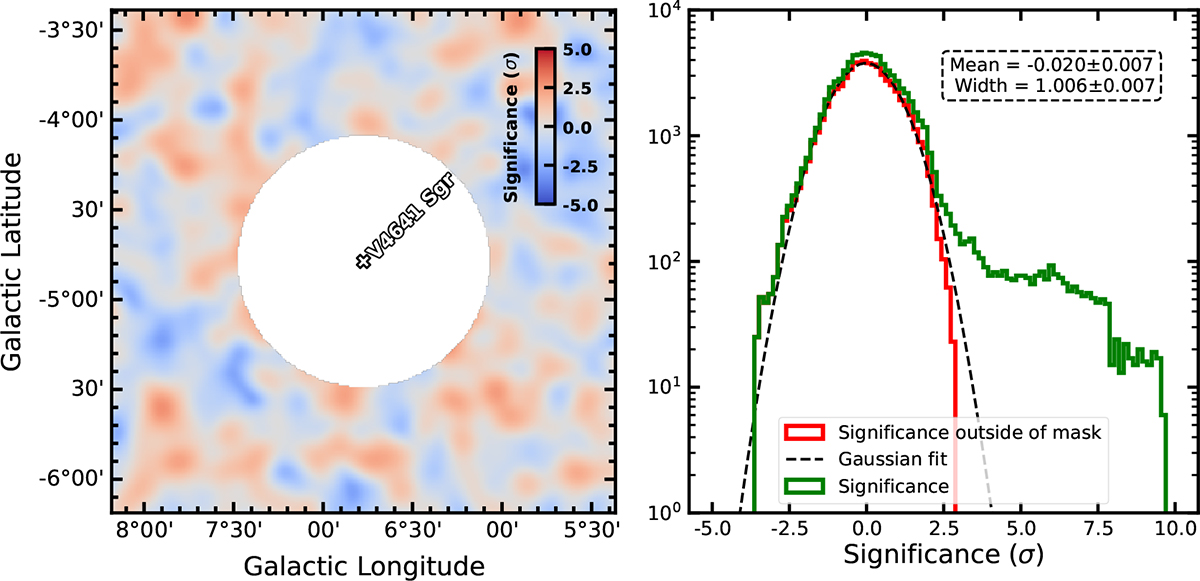
Fig. A.1.
Download original image
Left: The same significance map as in Figure 1, but with the exclusion mask covering V4641 Sgr and a colour range which focuses on the background fluctuation scales. Right: The distribution of the significance values outside of an exclusion mask covering V4641 Sgr (red line) and over the entire map (green line). A Gaussian function is fit to the red distribution (black line), with mean −0.020 ± 0.007 and width 1.006 ± 0.007, close to the values of mean 0 and width 1 expected if the background is perfectly modelled.
Current usage metrics show cumulative count of Article Views (full-text article views including HTML views, PDF and ePub downloads, according to the available data) and Abstracts Views on Vision4Press platform.
Data correspond to usage on the plateform after 2015. The current usage metrics is available 48-96 hours after online publication and is updated daily on week days.
Initial download of the metrics may take a while.