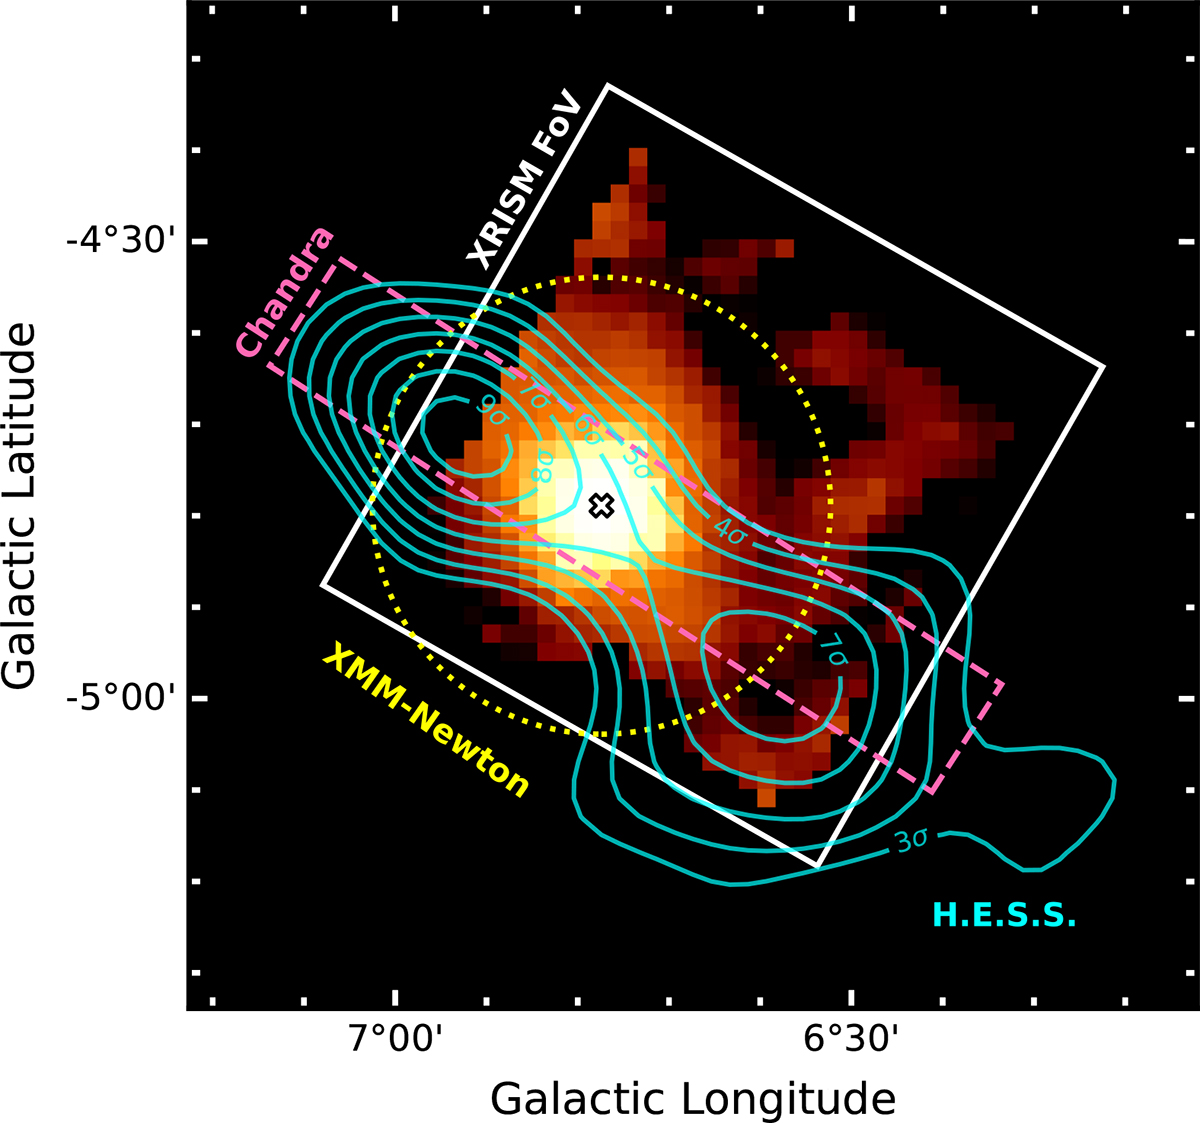
Fig. B.1.
Download original image
X-ray coverage. The orange colours show the XRISM image after the particle-background subtraction and vignetting correction (Figure 2c from Suzuki et al. 2025). The FoV of XRISM is denoted with a white box. The blue contours are the same as shown in black in Figure 1, outlining the H.E.S.S. emission. Existing coverage by Chandra and XMM-Newton is shown with pink dashed and yellow dotted lines, respectively.
Current usage metrics show cumulative count of Article Views (full-text article views including HTML views, PDF and ePub downloads, according to the available data) and Abstracts Views on Vision4Press platform.
Data correspond to usage on the plateform after 2015. The current usage metrics is available 48-96 hours after online publication and is updated daily on week days.
Initial download of the metrics may take a while.