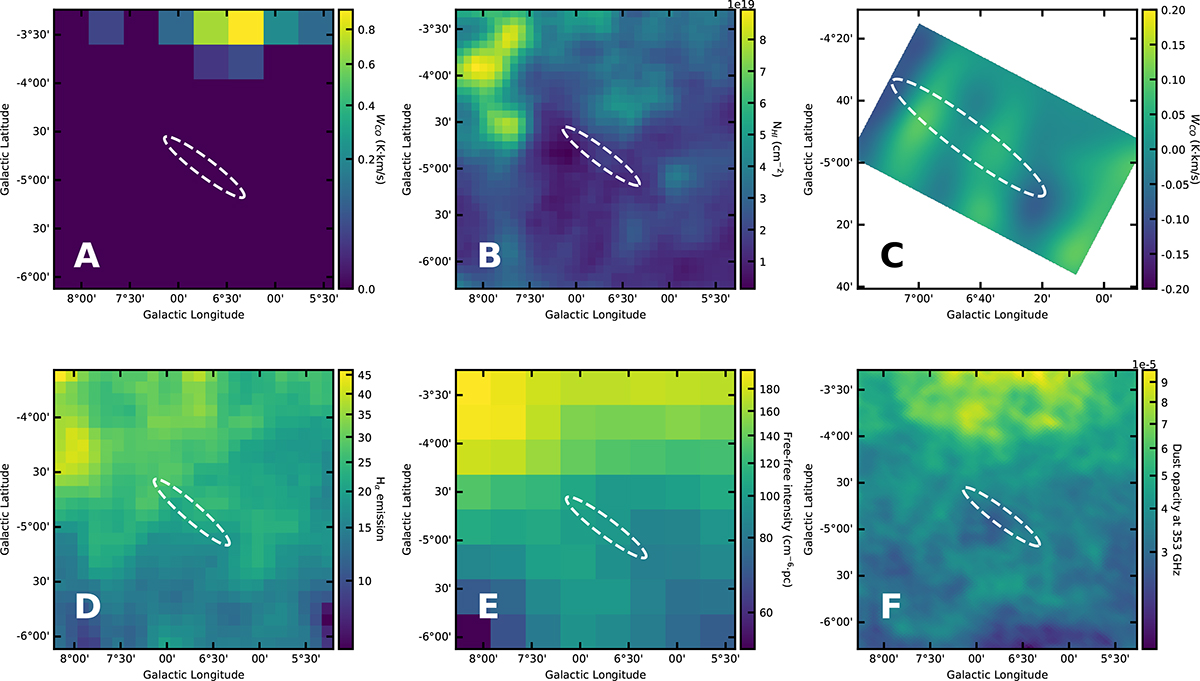
Fig. C.1.
Download original image
Gas around V4641 Sgr. Panel A: The velocity-integrated WCO map from the DAME survey (all velocities). The dotted white line shows the 68% containment region of model A. Panel B: The same as panel A, but the map shows the hydrogen column density integrated in a range of 20 km s−1 around the velocity corresponding to the position of V4641 Sgr. Panel C: The same as panel A, but the map shows the CO intensity (WCO) from the NRO data integrated in a range of 10 km s−1 around the velocity corresponding to the position of V4641 Sgr. The map has been smoothed with a 0.1° kernel to highlight the scales used to derive the density upper limit. The density upper limit was not derived using this map, but the noise level across all velocities. Panel D: The same as panel A, but the map shows the intensity of Hα emission integrated along the line of sight from Finkbeiner (2003). Panel E: Same as panel A, but the map shows the intensity of free-free emission integrated along the line of sight from Planck Collaboration X (2016). Panel F: The same as panel A, but the map shows the dust opacity integrated along the line of sight from Planck Collaboration X (2016).
Current usage metrics show cumulative count of Article Views (full-text article views including HTML views, PDF and ePub downloads, according to the available data) and Abstracts Views on Vision4Press platform.
Data correspond to usage on the plateform after 2015. The current usage metrics is available 48-96 hours after online publication and is updated daily on week days.
Initial download of the metrics may take a while.