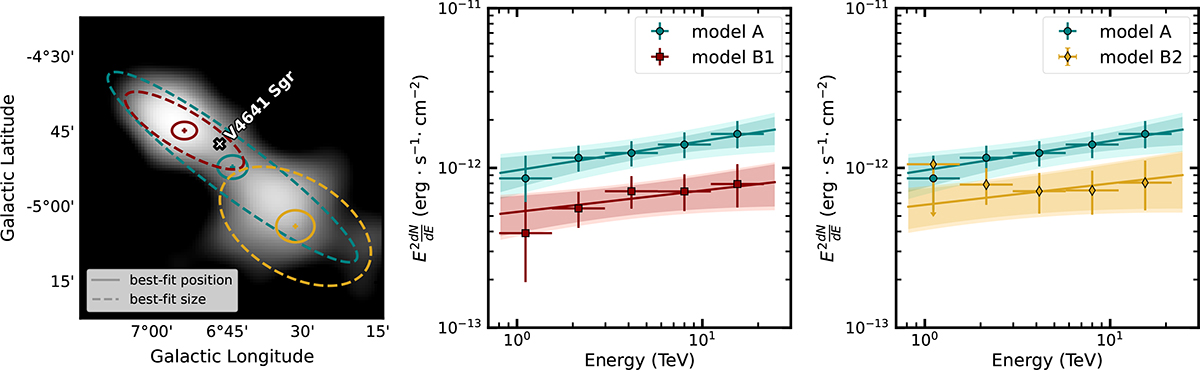
Fig. 2.
Download original image
Left: Significance map. The 68% containment regions (corresponding to 1.5σ for a 2D Gaussian) of the spatial models are overlaid. The best-fit extent is depicted with dashed lines in teal for model A (see Section 4.1), and in red and yellow for models B1 and B2 (see Section 4.1.2), respectively. The best-fit position and its 95% confidence intervals are shown with crosses and solid lines using the same colour scheme. Middle: The measured spectral energy distribution (SED) for models A (teal circles) and B1 (red squares). The solid line depicts the spectral shape of the best-fit power law. The dark and light shaded areas depict the statistical and systematic error bands, respectively. The error bars represent the combined systematic and statistical errors. The upper limits are shown at the 95% confidence level. Right: The symbols follow those of the middle panel, but for models A and B2 (yellow diamonds).
Current usage metrics show cumulative count of Article Views (full-text article views including HTML views, PDF and ePub downloads, according to the available data) and Abstracts Views on Vision4Press platform.
Data correspond to usage on the plateform after 2015. The current usage metrics is available 48-96 hours after online publication and is updated daily on week days.
Initial download of the metrics may take a while.