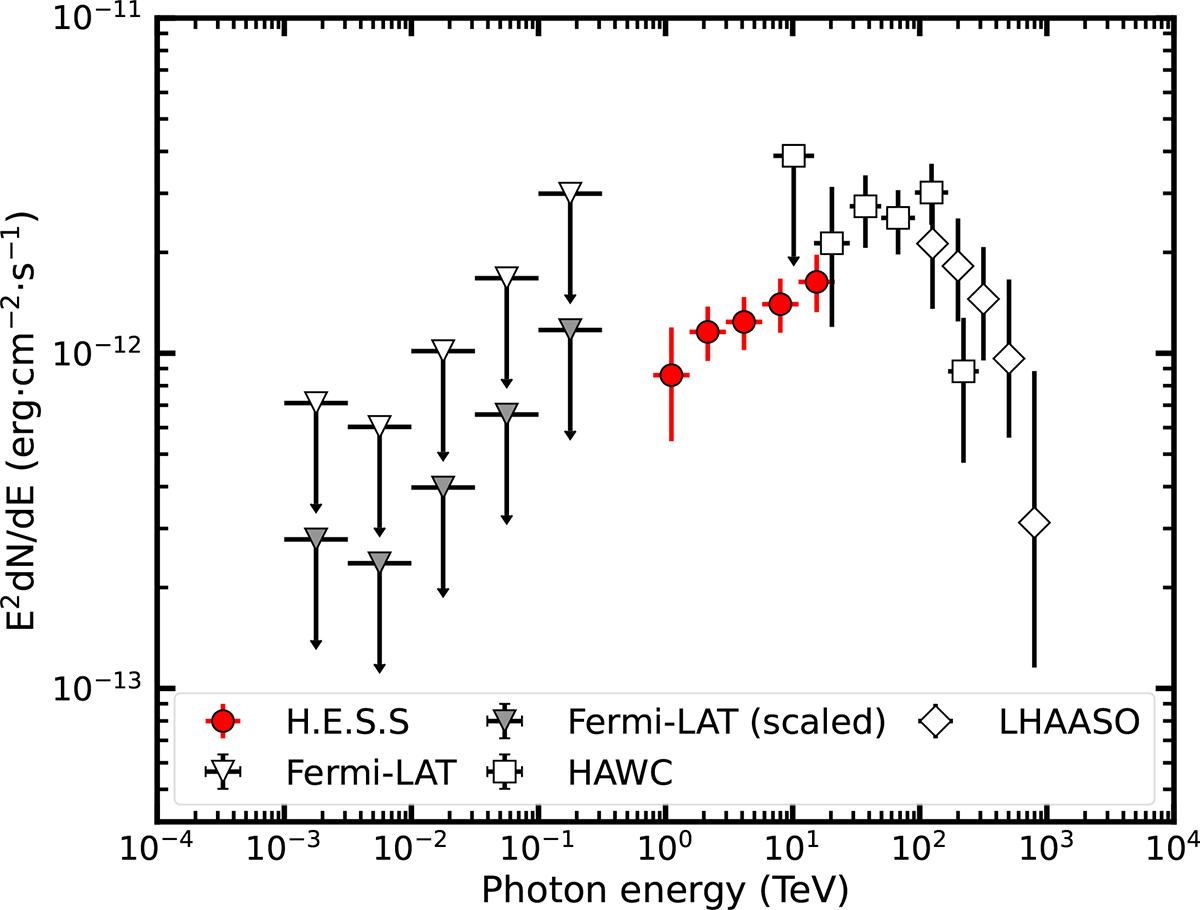
Fig. 3.
Download original image
Broad-band spectral energy distribution. Flux points and upper limits measured by H.E.S.S. (red circles), HAWC (squares), LHAASO (diamonds), and Fermi-LAT. The Fermi-LAT points are shown both as published in Zhao et al. (2025) (light triangles) and re-scaled to the H.E.S.S. emission region size (dark triangles). The broad-band spectrum is observed to rise sharply until a peak forms at energies of ≈100 TeV, further extending up to energies of several hundreds of TeV.
Current usage metrics show cumulative count of Article Views (full-text article views including HTML views, PDF and ePub downloads, according to the available data) and Abstracts Views on Vision4Press platform.
Data correspond to usage on the plateform after 2015. The current usage metrics is available 48-96 hours after online publication and is updated daily on week days.
Initial download of the metrics may take a while.