Fig. 4.
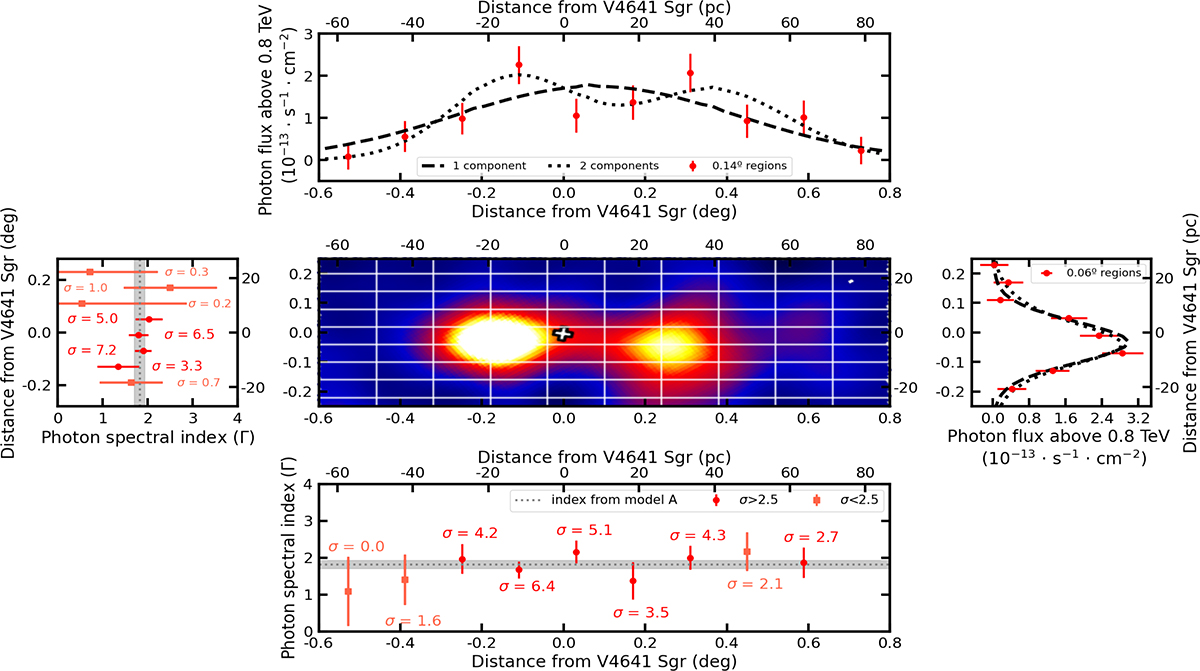
Download original image
Profiles along and across the emission. Centre: Rotated and scaled version of the significance map is shown to help visualise the geometry of the different regions used to derive profiles. Top: The red circles represent the measured flux above 0.8 TeV along the major axis as a function of distance to V4641 Sgr. Distances are provided in degrees and parsecs adopting a distance of 6.2 kpc. The dashed and dotted lines depict the predictions of models A and B, respectively. Bottom: The gamma-ray spectral index measured along the major axis in the same regions. Square and round symbols indicate when emission is detected inside the region with significance below or above 2.5σ, respectively. A dotted grey line and shaded region indicate the best-fit value and statistical uncertainty of the index parameter in model A. The best-fit index at distance ≈0.7° is negative and is thus not visible in the plot. The significance of the emission in that region is 0.3σ. Middle left: The symbols follow those of the bottom panel, but measured across the emission region. Middle right: The symbols follow those of the top panel, but measured across the emission region.
Current usage metrics show cumulative count of Article Views (full-text article views including HTML views, PDF and ePub downloads, according to the available data) and Abstracts Views on Vision4Press platform.
Data correspond to usage on the plateform after 2015. The current usage metrics is available 48-96 hours after online publication and is updated daily on week days.
Initial download of the metrics may take a while.