Fig. 5.
Download original image
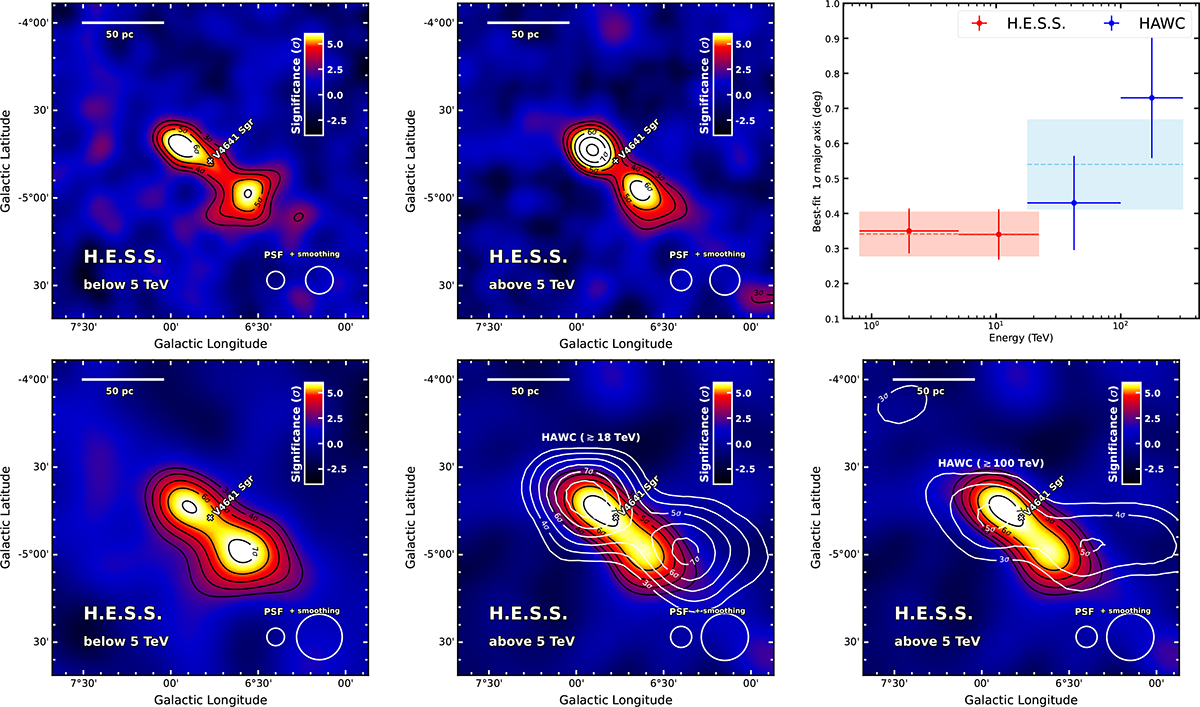
Significance maps in the energy bands. The symbols and colours follow those of Figure 1, but for photon energies below 5 TeV (top left) and above (top middle). Significance maps derived with a larger smoothing kernel of 0.12° are shown in the bottom row. The map for photon energies above 5 TeV is repeated to show the contours from the two HAWC significance maps provided in Alfaro et al. (2024). Finally, the top right panel shows the size of the major axis in the “model A” fit for both H.E.S.S. (red points) and for the HAWC publicly available data (blue points). The dashed lines and shaded bands represent the best-fit size and uncertainty derived in larger energy ranges as presented in Table 1 and Alfaro et al. (2024). The error bars/bands represent the combined statistic and systematic uncertainty.
Current usage metrics show cumulative count of Article Views (full-text article views including HTML views, PDF and ePub downloads, according to the available data) and Abstracts Views on Vision4Press platform.
Data correspond to usage on the plateform after 2015. The current usage metrics is available 48-96 hours after online publication and is updated daily on week days.
Initial download of the metrics may take a while.