Fig. 6.
Download original image
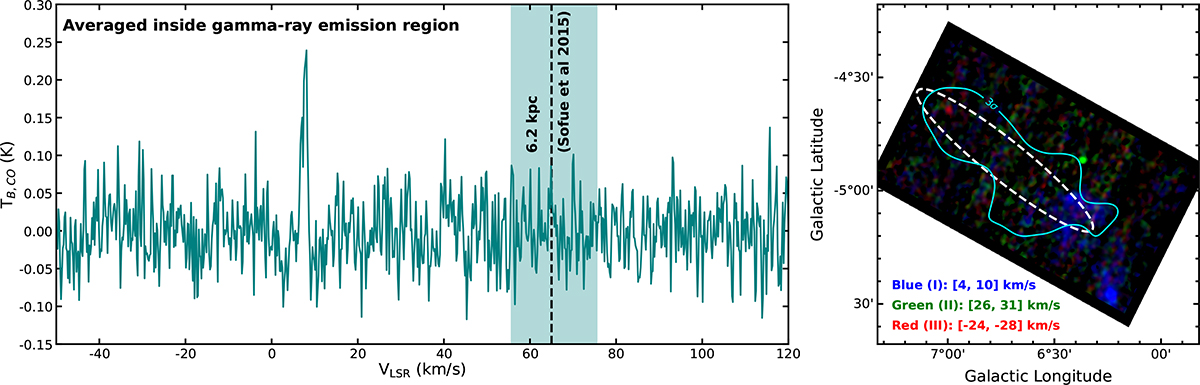
Molecular gas around V4641 Sgr. Left: The brightness temperature profile of the CO emission averaged inside of the 68% containment region of model A. The shaded range indicates a range of 10 km s−1 around the velocity corresponding to the position of V4641 Sgr. Note that this shaded band is for illustration purposes only, and that the density estimate reported in the text uses the noise level across the entire velocity range measured, regardless of what distance they correspond to. Right: The RGB image depicting the integrated CO intensity in the three velocity ranges where small clouds are identified, unrelated to V4641 Sgr. Smoothing with a Gaussian kernel of width 30 arcsec width was used to facilitate visualisation. The blue line shows the 3σ contour of the H.E.S.S. significance map (Figure 1). The dashed white line shows the 68% containment region of model A.
Current usage metrics show cumulative count of Article Views (full-text article views including HTML views, PDF and ePub downloads, according to the available data) and Abstracts Views on Vision4Press platform.
Data correspond to usage on the plateform after 2015. The current usage metrics is available 48-96 hours after online publication and is updated daily on week days.
Initial download of the metrics may take a while.